Hi, I'm Ryan, CTO at airCloset.
This post is about unifying a production codebase spanning 46 repositories across multiple services into one knowledge graph, using static analysis.
Internally we call it code-graph, and I built it between January and March of this year.
Three things I want to write down:
- Why "just letting AI read the code" isn't enough, and why I had to chase down the connections that cross repository boundaries
- How I extracted boundaries across 46 repos and a zoo of frameworks (jQuery / AngularJS / Express / NestJS / TypeORM / Redux Axios ...)
- What 3 months of trial and error solved, and what it didn't
This is Part 1, covering the construction of code-graph itself, the painful parts, and the issues that remained. Part 2 will be about service-product-graph (SPG) — a layer I built on top of code-graph to compensate for what static analysis couldn't do alone.
What Was This For?
A long-running production codebase usually looks something like this:
- Multiple services and multiple teams touching it
- Each era's framework still alive and mixed in
- Dependencies via API, DB, and Event are tangled — not clean 1 front-to-back relationships:
- The same API gets called from multiple repositories (= n callers)
- The same DB table is written to and read from across multiple repositories (= n)
- For Events, just looking at the emit side doesn't tell you how completely the subscribe side is covered — it's practically untraceable
The starting point was wanting to ask AI: "show me the blast radius," "tell me what breaks if I change this," — across this entire codebase.
The naive answer is: "just hand all 46 repositories worth of code to AI and let it analyze."
But that doesn't work, for two reasons:
- Context window: 46 repositories × years of accumulated code is just not a size you can hand to an AI in one shot
- Hallucination: even if you could, "read everything and extract the relationships" is an inference task. It misses things, it makes mistakes. That's not usable for impact analysis on a production system
So the first idea I landed on was: build a knowledge graph externally, via static analysis. That's the starting point of code-graph.
Scale: 46 Repositories
The target splits into two graphs:
- air-closet graph (37 repos): a graph that spans multiple services like airCloset, Men's, WMS, and more
- mall graph (9 repos): airCloset Mall and related
So 46 repositories in total.
The thing to notice is that this isn't "one service with 37 repos." It's a collection of multiple services that adds up to that scale. Making the dependencies that cross service boundaries visible as cross-repo edges is exactly what the boundary nodes discussion below is about.
Why Boundary Nodes Matter
This is the heart of the article.
When you want AI to understand code, getting it to "read what's in front of it, plus what's next to it" is honestly not hard. grep, open the file, hand it to the model — that works fine.
For a small codebase, that's enough. But at scale, you hit the context window and hallucination problems mentioned above. I suspect most readers can relate.
One way to improve this is to statically analyze the codebase, convert it into a knowledge graph, and serve it to AI through MCP. That's the approach.
The first step was static analysis with tree-sitter (an OSS library that parses source code into syntax trees — it supports a lot of languages and is what VS Code and similar editors use for syntax highlighting; I genuinely recommend it if you want to build something in this space). It's a great tool, but on its own it doesn't solve everything.
What it doesn't solve is tracing relationships that cross boundaries — APIs, databases, and so on. tree-sitter can extract the relationships between variables, functions, and other in-language constructs. But it can't extract those boundaries.
The thing that humans and AI alike get stuck on, in practice, is exactly that — code connections that cross boundaries:
- The same API is being called from another repo you weren't looking at
- The frontend in repo A and the nightly batch in repo C might both hit
/api/v1/users/me - Looking at just one of the repos, AI has no way of knowing
- The frontend in repo A and the nightly batch in repo C might both hit
- The same DB table is being read or written by some batch process you don't know about
- When you're modifying service-side code, some batch in a different location might be reading and writing the same table
- Misjudge the blast radius and you get data inconsistency
- The subscribers for this event might not be fully accounted for
- With distributed pub/sub, looking only at the emit side doesn't let you cover the subscribe side
- Something runs somewhere you don't know about
In short: getting AI to understand the code on the other side of a boundary, without hallucinating. That's the goal.
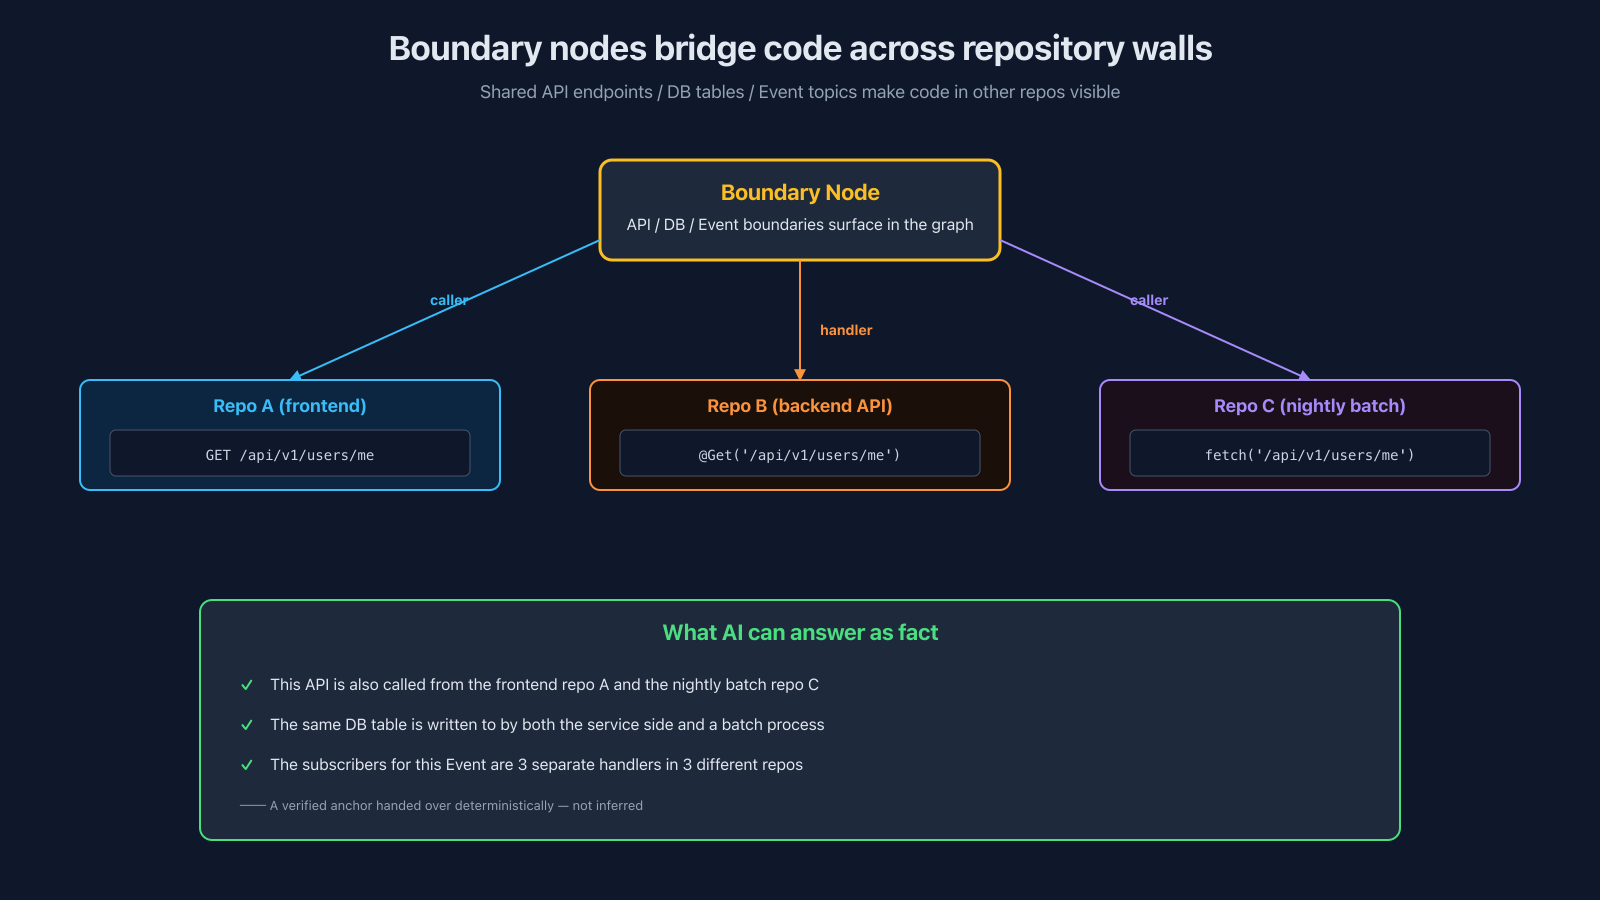
If you have boundary nodes, AI can answer "this API is also called from repo X" as a fact. Instead of asking AI to infer, you hand it a fact that's already been resolved.
Yes, there is inference during the extraction phase — TypeScript Compiler and Gemini both contribute. But the results are persisted as confirmed values in the graph, and a daily boundary-analysis cron (covered below) lets us notice drift the next morning. By the time AI consumes the graph, only verified facts flow to it.
AI has a tendency to answer "with whatever it can see" rather than saying "I don't know." That's where silent hallucinations creep in — wrong answers that neither AI nor the human catches. Boundary nodes are what physically prevents that. They give AI a verified place to stand.
Construction: tree-sitter Base, With TypeScript Compiler and Gemini Where Needed
Normal code structure (function calls, class inheritance, imports) is relatively straightforward to extract with tree-sitter. Walk the AST, turn functions / methods / classes / fields into nodes, connect references with edges. Just grind through it.
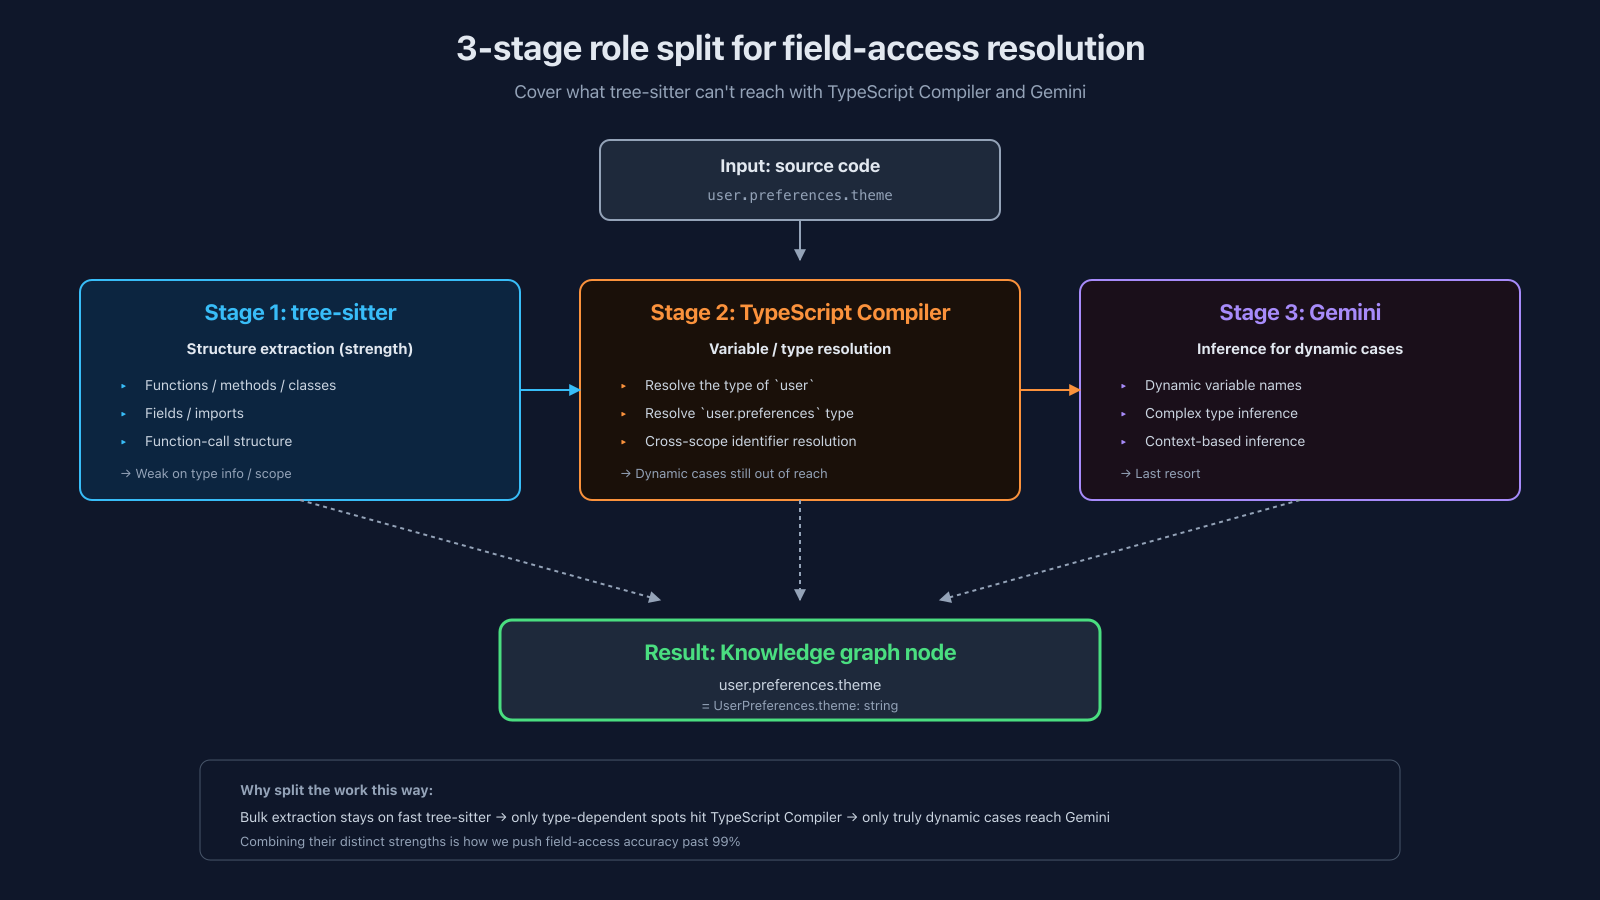
The catch is that while tree-sitter is great at building syntax trees, it's weak on type information and scope resolution. To accurately follow a field access chain like user.preferences.theme, you need to resolve what type the variable user is and where it's defined. tree-sitter alone can't reach that.
So for field-access resolution we use TypeScript Compiler API and Gemini in combination. tree-sitter extracts the structure → TypeScript Compiler resolves variables and types → for the dynamic cases that even that can't reach, Gemini infers. Three stages with distinct responsibilities, which is how we push field-access accuracy up.
We define 21 edge types:
CALLS(function call) /EXTENDS(inheritance) /IMPLEMENTS(interface implementation), etc. — the basic structure tree-sitter can give usCALLS_API(caller) /HANDLES_API(handler) — API boundaryEMITS_TO(emitter) /SUBSCRIBES_TO(subscriber) — Event boundaryWRITES_TO/READS_FROM— DB boundary- and more
The real battle starts when you try to extract the boundary edges (CALLS_API / HANDLES_API / EMITS_TO / SUBSCRIBES_TO / WRITES_TO / READS_FROM).
Extracting and Joining Boundary Nodes: 3 Months of Trial and Error (Jan–Mar)
Unlike normal code, boundaries (API endpoints, DB tables, Event topics) are written in wildly different ways depending on the framework, language, technical area, library, repository, and the person who wrote it.
Take "define an API endpoint": is it Express? NestJS with a @Get() decorator? A Fastify route? Each one produces a completely different AST shape. And the same repo can contain multiple patterns simultaneously.
And it's not just extraction that's hard. Joining the extracted boundaries on the graph is its own headache. For the same API path or DB table name, you get:
- Casing variation: camelCase / snake_case / PascalCase
- Trailing-slash variation (
/users/mevs.users/me) - The boundary name itself is a variable (
${baseUrl}/users/me)
…all mixed together. Normalizing all of that and correctly joining caller to handler, emitter to subscriber, writer to reader was genuinely the painful part.
And this had to happen across all 46 repositories × the framework zoo.
Looking back at the actual git history from that period, you see new parsers and detectors being added almost every week, noise filters going in, and concept renames landing. Here are the main commits from January through March, in order (the commit prefix starts as graph-rag — the stack was originally named after the "knowledge graph + RAG for LLM consumption" framing — and is renamed to code-graph on February 15; a few late-February commits still carry a short-lived graph prefix from that transition):
January: Starting Out, and Realizing tree-sitter Alone Isn't Enough
- 2026-01-15 ─
feat(graph-rag): add TypeScript parser with tree-sitter— the starting commit - 2026-01-15 ─
feat(graph-rag): add graph builder with BigQuery storage— graph data is written to BigQuery - 2026-01-19 ─
feat(graph-rag): add TypeScript Compiler-based variable resolution for field extraction— realized that tree-sitter alone couldn't resolve variable types, brought in the TypeScript Compiler API alongside it
February: Framework Diversity, Fighting Noise
- 2026-02-02 ─
feat(graph-rag): add frontend parser for jQuery/Vanilla JS codebase— jQuery / Vanilla JS frontend code - 2026-02-03 ─
feat(graph-rag): add AngularJS Page detection for frontend BFS— AngularJS page detection (older framework, still very much running) - 2026-02-15 ─
refactor(code-graph): consolidate 18 MCP tools into 5 with deep subgraph traversal— the toolset had ballooned to 18, consolidated to 5 (also the moment the stack was unified under the namecode-graph) - 2026-02-18 ─
fix(code-graph): reduce graph noise by filtering Type nodes, external lib CALLS, and Storybook files— noise reduction: filter out Type nodes, external library CALLS, Storybook files - 2026-02-19 ─
fix(code-graph): extract path aliases from tsconfig paths in addition to make-symlink+fix(code-graph): resolve @alias path imports for CommonJS symlink patterns— the path-alias pain: tsconfig paths, make-symlink, and on top of that the CommonJS symlink pattern — three different mechanisms to support - 2026-02-19 ─
feat(code-graph): add stop_at=boundary option to trace_connections— option to stop traversal at boundary nodes (explicit traversal scoping / node-explosion mitigation) - 2026-02-21 ─
feat(graph): add typeORM JOIN detection, NestJS decorator parsing, Fetcher API detection— TypeORM JOINs / NestJS decorators / Fetcher API support - 2026-02-21 ─
fix(graph): pass fullFileCode to Redux Axios variable resolver for scope-based extraction— Redux Axios variable resolver fix
March: Concept Cleanup and Precision
- 2026-03-08 ─
refactor(code-graph): rename __external__ to __boundary__— concept cleanup: standardize on "boundary node" rather than "external resource" - 2026-03-16 ─
refactor: remove db-dictionary from code-graph stack— split the DB schema dictionary (the layer that lets you look up table / column definitions) off into its own graph to evolve independently - 2026-03-24 ─
fix(code-graph): infer table names from dynamic variable names— table-name inference from dynamic variable names - 2026-03-24 ─
feat(code-graph): add orphan boundary node cleanup script— cleanup script for orphan boundary nodes
What This Timeline Tells You
Every single week there's a new framework or pattern being handled. The work of "extracting boundary nodes" is, fundamentally, adding parsers for each new way people write the boundary.
Just listing the frameworks / mechanisms that showed up:
- tree-sitter (TypeScript / JavaScript / Go / Dart (Flutter))
- TypeScript Compiler (variable resolution)
- jQuery / Vanilla JS
- AngularJS
- Express / Koa / Fastify
- NestJS (decorator parsing)
- TypeORM (DB JOIN detection)
- Fetcher API
- Redux Axios (variable resolver)
- 3 different path-alias schemes (tsconfig paths / make-symlink / CommonJS symlink)
This isn't a "TypeScript / JavaScript / Go / Dart static analysis" story you can wrap up in one sentence. The air-closet codebase is a collection of long-running production systems where every era's framework still coexists. We had to pick up, from the AST, the era-specific meaning of "here's an API endpoint," "here's a DB call," "here's an Event subscription."
Why I Was So Particular About Accuracy
90% is completely unusable.
Take "list every piece of code that calls this API." If you recall only 90% of the callers, then 10% of the relevant code is invisible to AI. When you're using code-graph for blast-radius investigation, that invisible 10% is what causes the incident. That's single-hop recall.
And it gets worse the further you walk. For multi-hop graph traversal, every hop multiplies in: at 0.9 per hop you get 0.81 at 2 hops, 0.729 at 3, ~0.59 at 5, ~0.35 at 10 — after just a handful of hops you're at less than half. Push it to 0.99 and you get 0.98 at 2 hops, 0.95 at 5, ~0.90 at 10. Whether the system is usable in practice is decided by that single-digit difference between 90% and 99% — and it bites you on both axes: single-hop recall when you're enumerating, multi-hop confidence when you're traversing.
So every time a new boundary pattern showed up, we'd add a new custom parser, aiming to keep the boundary connection rate above 99%. We can't measure extraction recall directly — there's no ground-truth "every boundary that should exist" denominator — so the indicator we actually measure daily is "what fraction of callers / handlers are correctly connected on the graph" = the connection rate. The next section is about how that's monitored.
Boundary Analysis Is Running Today
The code-graph we built is still running daily.
Concretely, a boundary-analysis cron runs at JST 7
every morning. What it does:- API boundaries: match
CALLS_API(caller) withHANDLES_API(handler), and aggregate cross-repo connection rates - Event boundaries: match
EMITS_TO(emit) withSUBSCRIBES_TO(subscribe) - DB boundaries: aggregate cases where
WRITES_TOandREADS_FROMfrom different repositories touch the same table (= implicit cross-repo DB dependency)
The day-over-day numbers get compared, and if the connection rate drops by more than 5%, we get a Grafana alert.
This whole thing only makes sense because we have boundary nodes to compare against. We're monitoring the quality of the extracted boundaries themselves on a daily cadence. The kind of drift the connection rate catches by the next morning: "a parser fell behind a new pattern and a class of boundaries went invisible," "the repository layout changed and path aliases stopped resolving." There are failure modes the connection rate alone can't see — a caller-side parser regression that drops callers entirely will leave the surviving handlers still looking "connected" to whatever callers remain, and the missing ones slip out silently. That's a separate axis we cover with day-over-day absolute node counts per repo / pattern.
What Still Doesn't Work
Even after all that, a handful of issues remain that I can't solve at the root.
1. No Semantic Search (an Entry-Point Problem)
The search MCP tool only does LIKE-based substring matching.
If you're in the middle of development and want to follow connections starting from a function you're already looking at, that's fine — you can pull it up by function name or filename directly.
The problem shows up when you're investigating a production bug or a customer support ticket. You have no idea what filenames or function names are involved at the start. When the input is "the subscription-fee calculation for members seems off," and you want to walk to the related code from there, no natural-language query into the graph means you can't find the entry point in the first place.
The intent was: "instead of grepping the whole codebase, navigate relevance via graph RAG." What we ended up with is a structure where you have to grep at the entry point and infer your way in.
2. Node Explosion
If you naively turn the AST into a graph, every builtin function, anonymous function, and internal utility becomes a node. The map call you don't care about, the internal helper you don't care about — they're all nodes.
Trigger a traversal starting from one node, and within a few hops you're dragging in helpers, types, and primitives until the node count explodes. There's no axis built into the graph structure for "filter by relevance."
We work around it with explicit controls like stopping traversal at boundary nodes, but that's a workaround, not a root fix.
3. To Know What a Function Actually Does, You Still Have to Read the File
The graph tells you "something is here," "this calls out to another repo." But what the function actually does still requires opening the file.
That makes the graph slow on its own. The codebase-investigation tool we built later uses the graph to narrow down candidate files and then hands those to Git Server MCP to actually read — but the underlying graph-only resolution limit doesn't go away.
4. Operational Cost of Adding Parsers for Every New Boundary Pattern
Every time a new framework or library enters the codebase, we have to learn "how do they write boundaries in this thing" and add a new parser.
The parser directory already has 10+ custom detectors / extractors. There's no sign of the maintenance and extension cost going down — every time a new tech stack enters the codebase, the same work repeats.
Side Note: A Different Call Elsewhere — cortex
Note: "cortex" in this section is the internal codename for an AI platform I've been building in-house at airCloset. Unrelated to existing commercial products like Snowflake Cortex or Palo Alto Networks Cortex.
Setting code-graph aside for a moment: I also have a separate project — cortex — where I'm building an in-house AI platform from scratch (currently a single monorepo with 100+ apps).
On that project I did initially try the same approach as code-graph, but bailed out early and went with an annotation-based knowledge graph instead:
- It's a monorepo I'm assembling myself, so I can realistically annotate everything at once
- Use JSDoc tags to write intent directly into the code, and build the graph from that
- Vectorize that intent and store it on the node, so semantic search works
The decision to "write intent into the code and graph it" — and the trial and error that led to it — I covered in detail in a separate series. If interested: AI Harness Series, Part 2 (The Knowledge Graph at the Heart of cortex)
Annotation-Based Won't Work for Production Systems
And no, you can't take the same approach for the production-side codebase that code-graph deals with:
- Annotating all 46 repos at once isn't realistic
- Long-running production systems, touched by multiple teams, with mixed frameworks
- The precondition "put annotations into the code" doesn't hold
So the choice was: keep code-graph (static analysis) as the base, and evolve by layering on additional graph layers to compensate.
How we're trying to solve the issues above, I'll cover separately in Part 2.
To Be Continued
That's it for Part 1. Part 2 will be about how we try to get past the issues above.
The real story is less "thrown away" and more "evolved."
Thanks for reading this far.
comments (0)
no comments yet.