Hi, I'm Ryan, CTO at airCloset.
In Part 1, I walked through the four monitoring axes (application / infrastructure / CI / LLM) and the deliberately different shape each one ends up in. That's the write-side of the observability stack, more or less wrapped up.
But shaping the write side isn't the end of the story. The moment production data flows through the stack, you have to block the path PII can take to slip in — and that's true with or without AI. It's the kind of classic observability problem where, if you cut corners, you walk straight into a leak incident.
Add AI to the picture and the weight of that risk jumps. Log search used to be the domain of SREs and a handful of developers; even if PII slipped in, the population doing the searching was small. Once AI agents start querying logs broadly via MCP, both the range and the frequency of who searches explode. PII handling that was previously "we got lucky, nothing happened" turns into structural risk that surfaces hard.
And on top of that, if the observability stack isn't queryable by AI, the whole "AI-consumable observability" goal from Part 1 falls apart.
Part 2 is about how I reconciled these two — protecting PII while keeping searchability for AI — and how that combination ends up driving Self-Healing from CI failure to PR proposal.
The Observability Stack Is a Natural Path for PII
App emits a log → it lands in Loki → AI queries it through MCP. Stand up this naive flow and you get:
- Customer email addresses and phone numbers in error logs
- Order response payloads riding inside traces
- DB query logs that emit full table rows
Plain-text PII pooling in the observability stack means AI can search it directly. This isn't really an AI problem, it's an observability problem: the stack itself becomes a PII conduit. At the same time, if you scrub PII completely, you lose "I want to investigate Customer A's support ticket" as a query, which is a normal support workflow.
cortex (the internal AI platform[^cortex]) had to reconcile both. The key principle was: don't make "block the PII path" and "search by PII" mutually exclusive.
Multi-Layer PII Design — Six Layers
cortex's PII handling is six layers, each with a different role:
| Layer | Purpose | Mechanism |
|---|---|---|
| Write: BQ Policy Tag | Column-level access control | pii_high / pii_medium / pii_low three-tier taxonomy. Without fine-grained reader on the column, SELECT errors out with Access Denied (pure CLS — no dynamic masking) |
| Write: ETL DLP | Strip plain-text PII from derived tables | Cloud DLP redacts during transforms (customer support data, etc.). Placeholders like [EMAIL_ADDRESS] / [PHONE_NUMBER] preserve the structure |
| Write: log hashing | Plain text never reaches Loki | App-side hash via hashEmail (HMAC-SHA256 → 12-char prefix; key lives outside the observability stack) before log emit |
| Search: same function on both sides | Look up a specific customer's logs without ever touching plain text | Query-side runs the same hashEmail before sending to Loki |
| Output: MCP masking | Mask when AI consumes | Column-name detection replaces values with placeholders like ***@***.com |
| Identity separation | Internal staff email isn't customer PII | Edge Router HMAC-signs auth emails; used as attribution identifier |
The fourth row — search with the same function on both sides — is where the security / usability tradeoff gets really tight.
Hash on Both the Write and Search Sides
Naively "remove PII from logs" and you can no longer answer "let me look up Customer A's logs." But if you hash at write time and store that hash in the log, the search side can run the same hash function over the input and find the matching record. Plain-text email never touches either end.
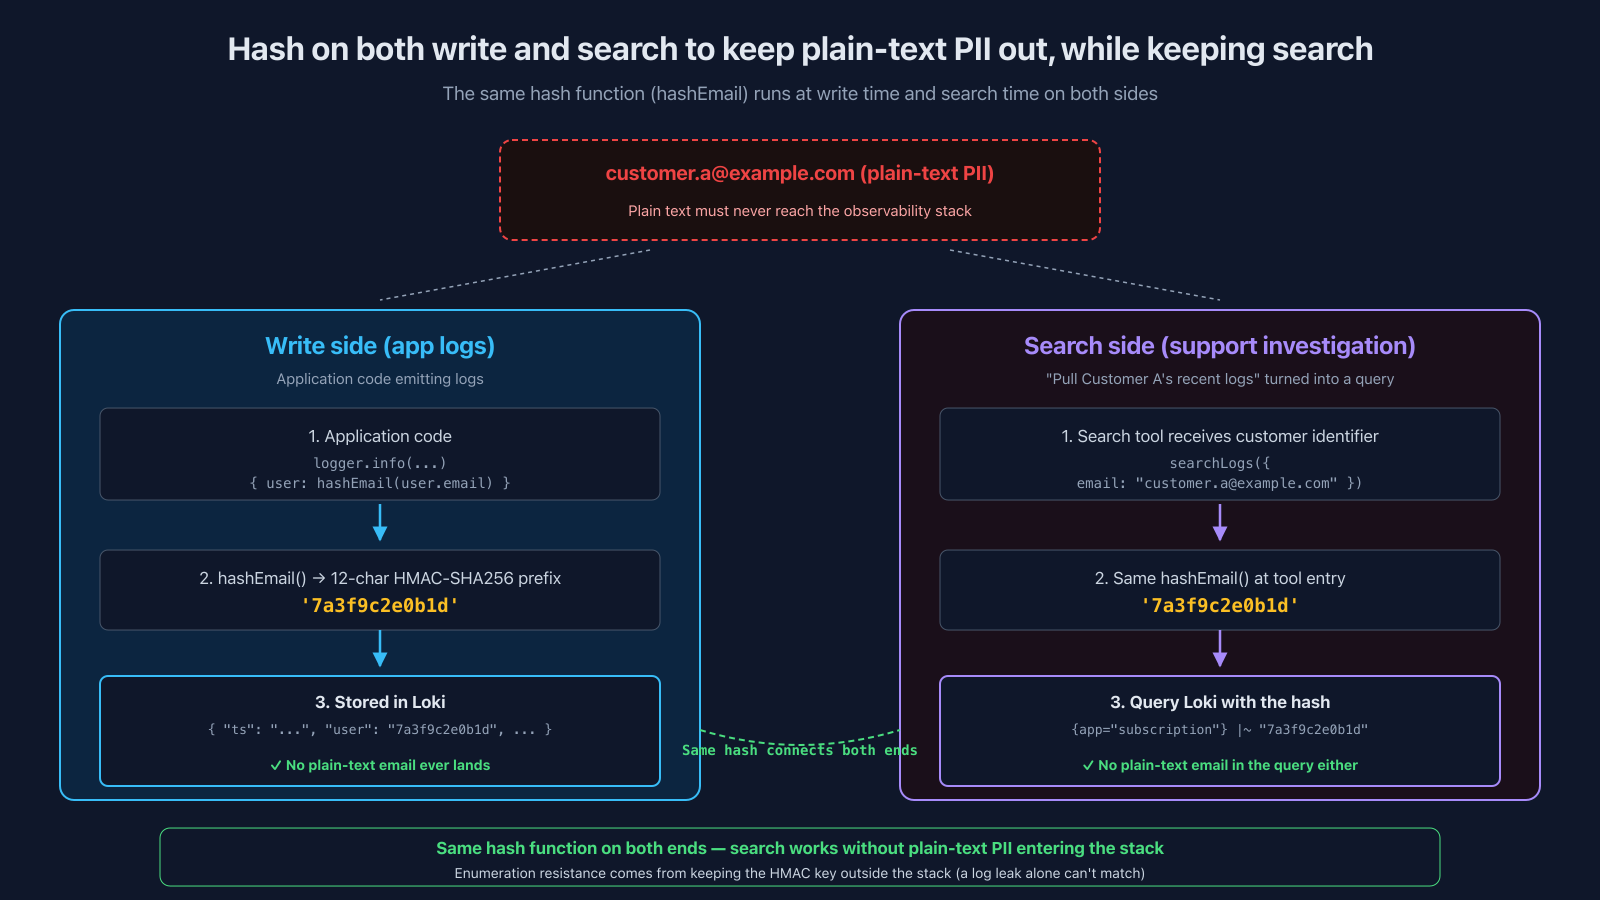
Concretely:
Write side:
// Application code
logger.info("Subscription updated", {
  user: hashEmail(user.email), // → '7a3f9c2e0b1d' (HMAC-SHA256 12-char prefix)
  plan: "monthly",
});
// → Only the hashEmail result ends up in Loki
Search side (when you want to pull a specific customer's logs):
The search tool's entry point puts the same hashEmail in front of every query. After passing through, only the hashed value reaches Loki:
// Search tool entry: hash first, then query Loki
const hash = hashEmail(input);
// → '7a3f9c2e0b1d'
const logs = await loki.query(`{app="subscription"} |~ "${hash}"`);
// → Returns logs containing the matching hash
Both sides run the same hashEmail, so logs from the same customer collapse to the same hash on lookup. Meanwhile:
- Plain-text email never enters Loki
- The query string Loki sees doesn't contain plain-text email either (only the hashed value reaches it)
- Enumeration resistance comes from keeping the HMAC key outside the stack. Email is a low-entropy, enumerable input space, so a bare one-way hash would let an attacker hash candidate emails forward and match. With HMAC plus a key held only at the write side and the search tool, a log leak alone isn't enough to enumerate
This reuses the property "same input → same hash" of hash functions in the form "the same function on both sides makes search work." The security / debug usability tradeoff compresses cleanly.
And of course, this is all just the app log layer. The BQ side is protected by Policy Tag-based column-level access control as its own layer (rows 1–2 of the table above). The whole thing is multi-layered.
One more thing worth noting: search tool input arguments (including MCP servers) carry plain-text only at the moment of arrival. The tool runs hashEmail immediately, so neither Loki nor the MCP tool-call log retains plain text. How the search tool handles its arguments is itself part of the multi-layer PII design.
Integration Surface — "Humans = Web, AI = MCP" on the Same Backend
Three observable shapes built, PII handled. The next question is who queries them, and how. The common trap is to build "human dashboard aggregations" and "AI data feeds" separately. The moment you do:
- Two implementations chasing the same question
- Numbers drift between them
- It becomes unclear which is canonical
- Aggregations for AI and for humans update on different schedules
cortex's choice: share one observability backend; only the consumer-facing interface differs.
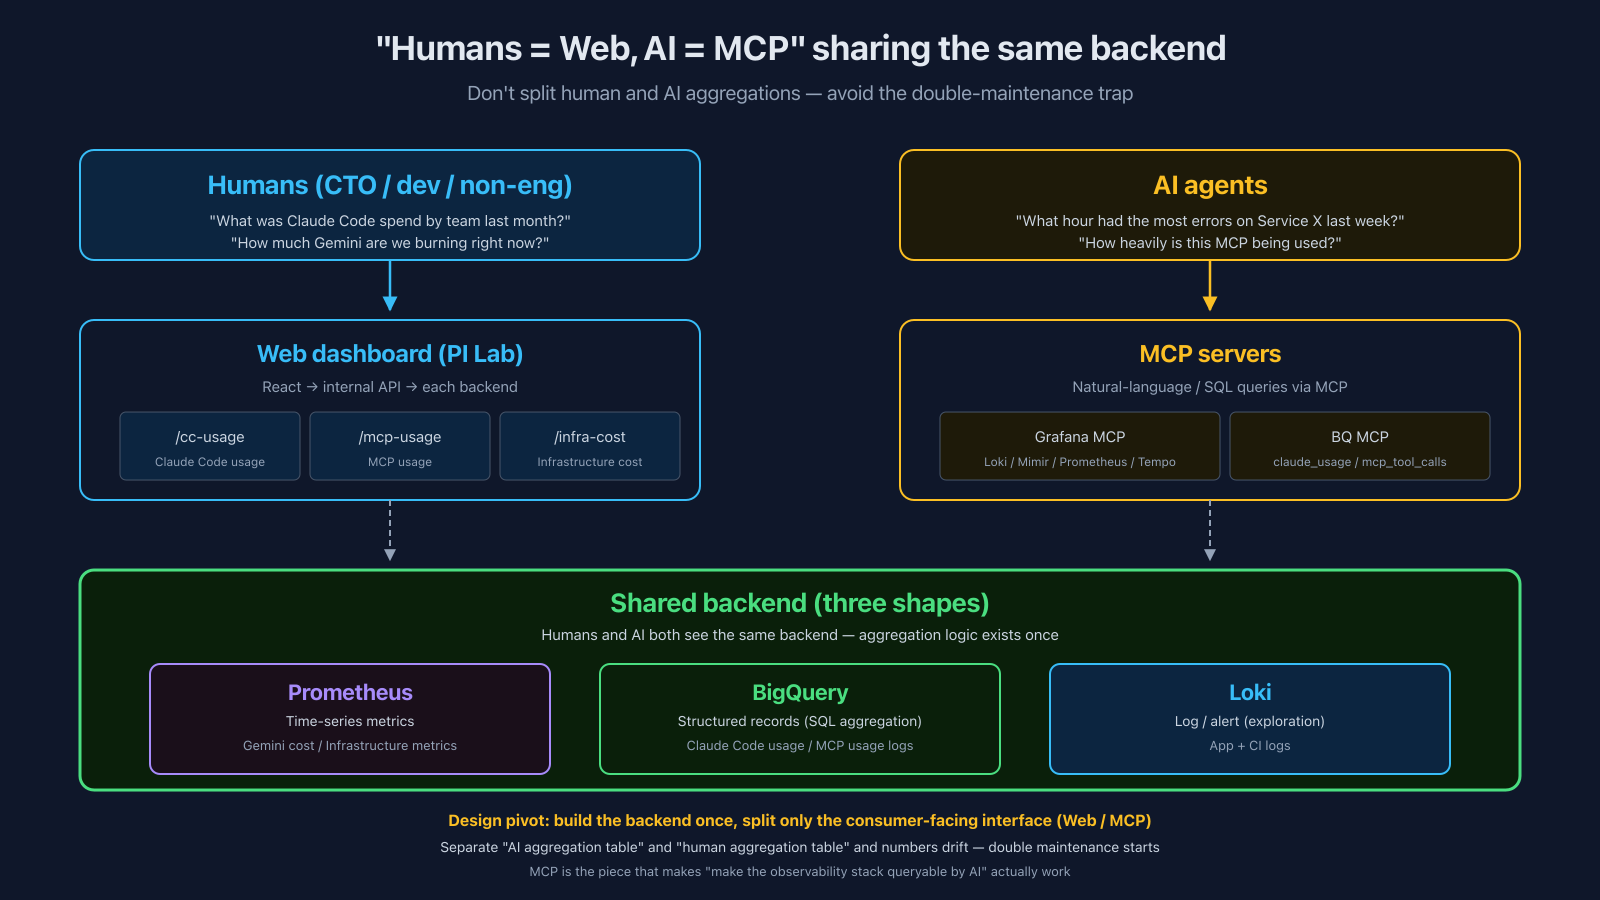
Human side: AI Operations Portal
There's an internal portal (codenamed PI Lab) that aggregates dashboards by monitoring target:
- Claude Code usage (the cc-usage screen from Part 1)
- MCP tool usage (by server / tool / user / team)
- Infrastructure cost (Gemini / GCP / AWS / GitHub on one screen)
- Alert state, deploy history, etc.
Here's what the MCP usage dashboard actually looks like:
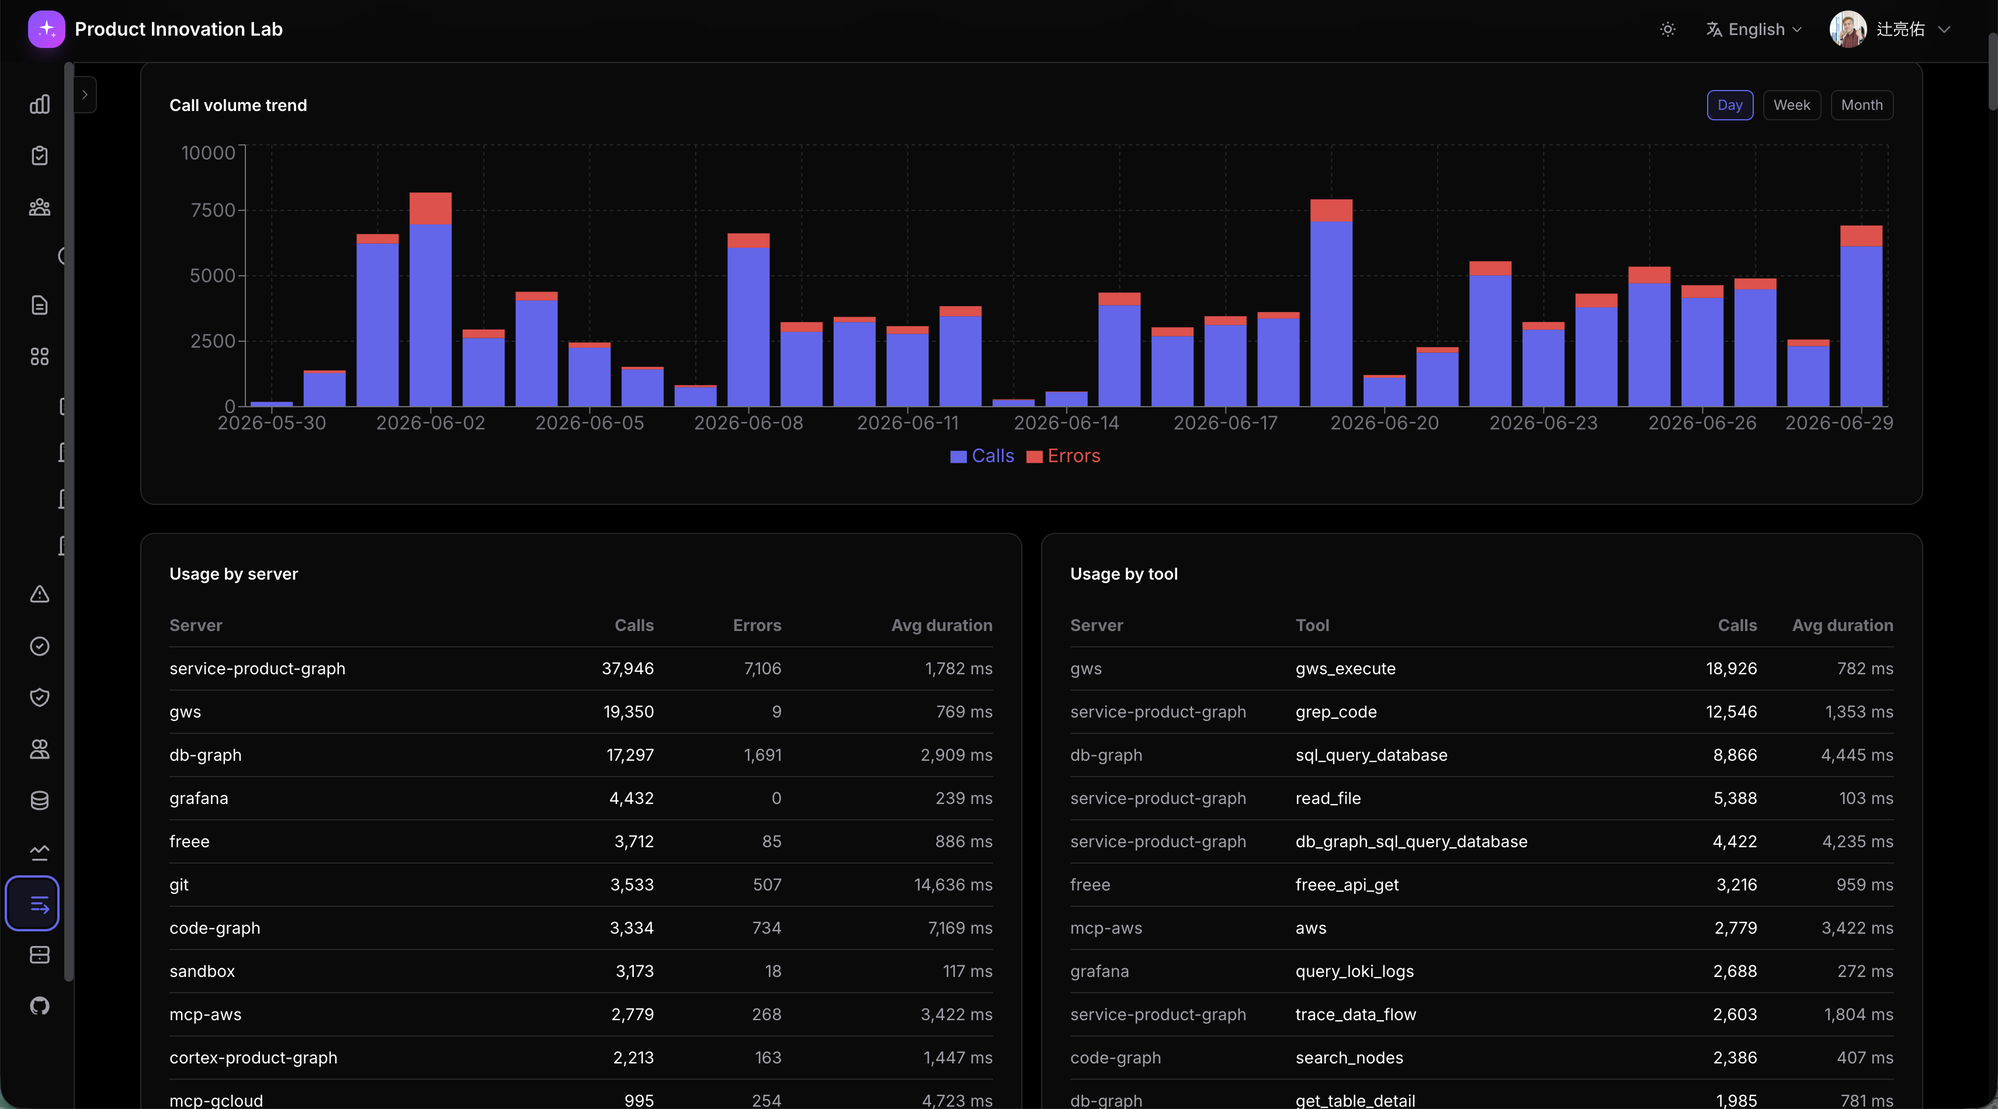
Over the past 30 days, service-product-graph had 37,946 calls (with 7,106 errors), gws had 19,350, db-graph had 17,297 — and that's just the top. Which MCP is used how much, where the failures are showing up — all visible at a daily glance. (The "high error rate" some servers seem to have is partly typed errors counted in — expected rejections like "permission denied" — so the interpretation needs care.) The "annotation graph MCP, ~50,000 calls / 73 users" figure from the previous series came from this same view.
These pages on the React side pull from BQ / Prometheus / Loki through an internal API. The aggregation logic lives at the API layer.
AI side: MCP
When AI agents need the same data, they go through purpose-specific MCPs:
- Grafana MCP — natural-language queries against Loki / Mimir / Prometheus / Tempo. "What time window had the most errors on Service X last week?" goes in as-is
- BQ MCP (via cortex-product-graph) — SQL queries against
claude_usage.claude_usage/cortex.mcp_tool_calls
The design pivot: the human dashboard and the AI MCP share the same backend. No separate "AI aggregation table" and "human aggregation table." Build the observability backend once, then provide a consumer-specific interface layer (web dashboard / MCP) on top.
In DDD terms, MCP and the web dashboard are both just presentation layers — different I/O channels into the same domain (the observability backend). Treating MCP as "something special" leads to duplicate implementations; treating it as one presentation layer form keeps the design clean.
That's exactly why "the observability stack is visible to AI" actually holds. Build the backend, but without an AI-facing presentation layer (= MCP), AI can't query it. MCP is the piece that makes "hand it to AI" actually work.
The Real Driver of Self-Healing
The layer that keeps the observability stack from being "just a screen to look at" is Self-Healing. I covered the full picture in AI Harness Series Part 4, so I'll skip the details here, but from the observability side, the start and end of the chain are clear:
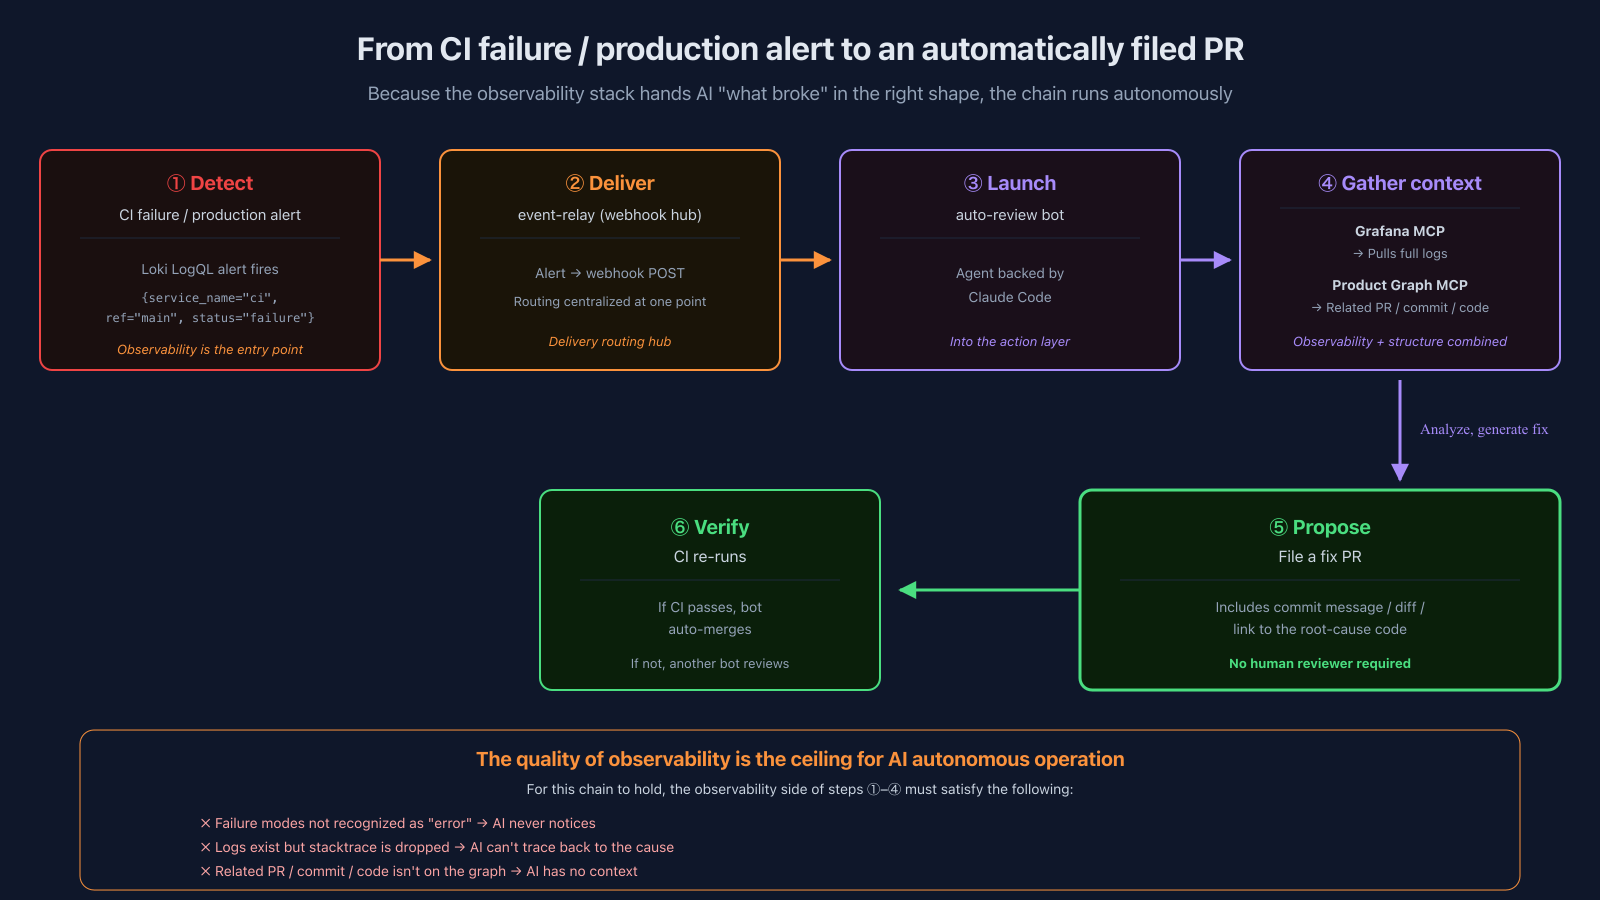
The flow:
- Detect — Production alert / CI failure fires a Loki LogQL alert
- Deliver — POST to event-relay (the internal webhook hub)
- Launch — auto-review bot starts up (= an agent backed by Claude Code)
- Gather context — The bot pulls full logs via Grafana MCP, traces related PR / commit / code via Product Graph MCP
- Propose — File a fix PR
- Verify — If CI passes, the bot auto-merges; if not, another bot reviews
So the starting point of Self-Healing is whether the observability stack can hand "what broke" to AI in the right shape. If errors aren't recognized / stacktraces aren't preserved / related code (PR / commit / graph) isn't reachable — any of those missing and the chain stops cold. (The specific failure modes are in the next section.) Put another way:
The quality of observability is the ceiling for AI autonomous operation.
That's the central claim of Part 2. Reframe the observability stack as "input that drives AI," not "monitoring infrastructure," and the priorities of your design decisions shift accordingly.
What's Still Open — Defining "What Counts as an Error" and the Stacktrace Design
The biggest remaining issue, honest version.
You can polish the observability stack to a mirror finish, but if the design of what counts as an error and whether the stacktrace survives falls apart, all of it is wasted. I touched on this earlier in AI Harness Series Part 2 in the context of cortex's internal knowledge graph, and it shows up on the observability side too.
Concretely, here are the failure modes:
try ~ catchswallows the error without logging → nothing reaches the observability stack- catch does log, but at
console.log-equivalent info level → not recognized as an error - Error gets emitted, but only
error.messageis written; stacktrace is dropped → AI can't trace back to the original code - An async error goes unhandled and the process falls over
These are all problems at the code that creates the observability entry point, not at the observability stack itself. No matter how polished the stack is, if the faucet at the entry point is broken, nothing flows out.
What's in place today is three layers, none of them complete:
- lint (static) — The
no-silent-catchrule blocks empty catches and.catch(() => null)-style swallows. But once there's any function call inside the catch, lint is satisfied — so patterns like "demote tologger.info(err.message)" or "log onlyerror.messageand drop the stacktrace" slip through statically - Guideline document — Rules like "use
serializeError(error)to store stacktrace as a structured field" and "droppingstackvialogger.error(err.message)is a Major violation" are written down in the internal guidelines. But static checking can't enforce these; they rely on human / AI review - AI auto-review — The PR auto-review bot does look at test coverage including "are error cases being tested," but it has no observability-specific checklist, so it can't systematically catch stacktrace design quality
In other words: "There's a guideline, lint catches some, AI review catches some, but it's not airtight" is the honest description. The real gap is that at the moment new code is being written, there isn't a harness that proactively suggests / completes "this should be treated as an error, this should keep its stacktrace." Auto-review picks things up at PR time, but a proactive harness for the observability entry-point design itself isn't built yet.
"Observability stack: done. Observability target design: still on humans." That's the honest picture. Closing that gap with a harness is the next step.
Closing — Static Edition + Dynamic Edition Are Lined Up; Merging Them Is the Next Series
The code-graph series was about reshaping a static analysis graph so AI could query it — handing the structure of code as fact. This two-part series was about handing what's happening in production right now, also as fact.
| Shape | What's Handed Over | |
|---|---|---|
| Static edition (code-graph + db-graph + annotation graph) | 3-graph parallel + SAME_ENTITY | Code and meaning |
| Dynamic edition (Part 1 + this post) | Prometheus / BQ / Loki + MCP | Production behavior and cost |
The honest part: these two still sit side by side, not joined. For cortex's stated principle of "don't let AI infer — hand it facts" to truly reach completion, the next step is to pour dynamic data into the static graph and merge them. This is the exact same gap I flagged as the "absence of dynamic analysis" residual at the end of code-graph Part 2: putting "how often is this edge actually used in production?" on the static graph's nodes. That's when "hand it as fact" reaches its final form.
Layer Self-Healing on top of static + dynamic and you get "AI autonomously operates," which works today. But merging the two editions into one graph is still ahead — that's the next series.
And one more time, observability target design (what counts as an error, whether stacktrace survives) is what really sets the ceiling. Harness-ifying that is the next homework item.
Thanks for reading this far.
comments (0)
no comments yet.