Hi, I'm Ryan, CTO at airCloset.
In the previous series, code-graph deep dive (Part 2), I wrote about making a 46-repo codebase semantically searchable for AI. The final issue I left open in that piece was the absence of dynamic analysis:
What lives on the graph is the fact that "this edge exists statically." How often that edge actually gets used in production isn't recorded.
A graph that gives you static facts is one thing. Telling AI what's actually happening in production right now is a separate problem. So the same shaping discipline I applied to the static graph needs to apply to the observability stack too.
This post is the first half of that story. I split it into two: Part 1 (this post) covers how I shape four different monitoring surfaces (application / infrastructure / CI / LLM). Part 2 covers PII handling, the integration surface, and Self-Healing — published a week later.
What Does "Observable to AI" Even Mean?
The biggest lesson from the code-graph series was: the data has to be shaped before AI can consume it. Throwing 46 repositories of source at a model blows past the context window and invites hallucination. So we shaped it — static analysis into a graph, boundary nodes given meaning, SAME_ENTITY joins between graphs — and only then handed it over.
The observability stack has the exact same problem. Throw raw production logs at AI and you get:
- Sheer log volume that drowns the context window
- No way for the model to tell errors from noise
- Metrics, logs, and traces that don't link to each other
- Questions like "what are we spending right now" that raw logs don't answer at all
In other words, logs have to be reshaped before AI can use them. Same problem, different domain.
The catch is that the right shape depends on what you want AI to answer. At cortex (the internal AI platform1), I split the monitoring surface into four axes and let each one settle into its own form:
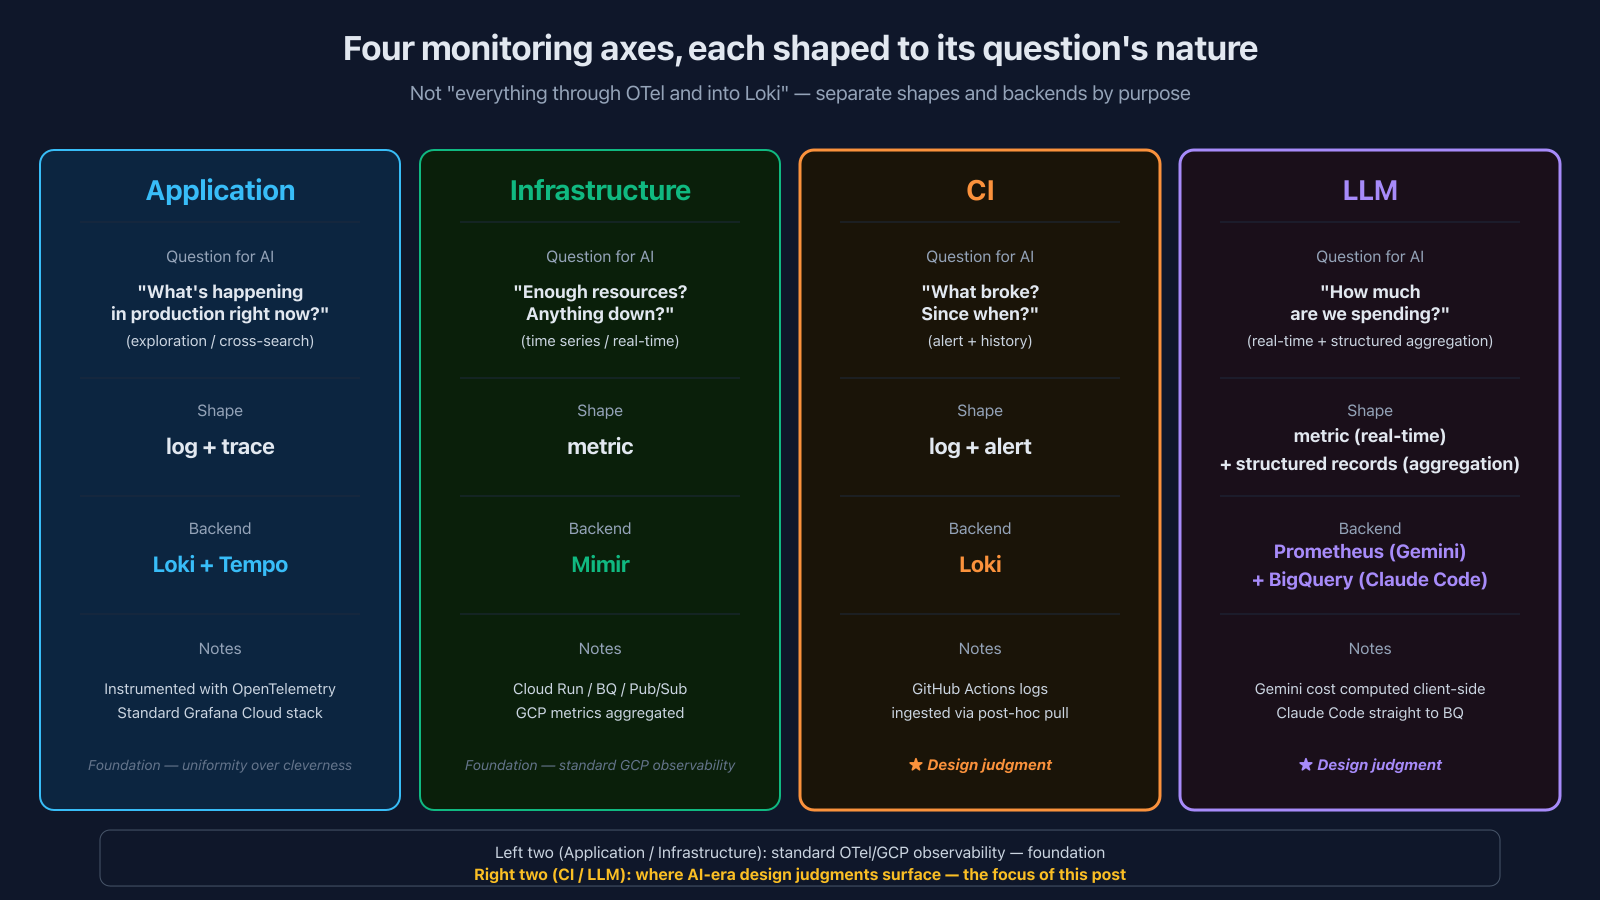
| Monitoring target | What you want AI to answer | Shape |
|---|---|---|
| Application | "What's happening in production right now?" (exploration) | log + trace |
| Infrastructure | "Do we have enough resources? Anything down?" (time series) | metric |
| CI | "What broke? Since when?" (alert + history) | log + alert |
| LLM | "How much are we spending? Who's using how much?" (real-time + structured aggregation) | metric + structured records |
"Just push everything through OTel and dump it all in Loki" is an option. But the moment you do, you're asking one backend to answer wildly different kinds of questions — real-time "what's spending right now" alongside "monthly cost broken down by team via SQL" — and one of them is going to suffer. Splitting by purpose is the choice I made.
Let me walk through each of the four axes. Application and infrastructure are the foundation, so I'll keep those brief. CI and LLM are where the AI-era design judgments actually surface, so I'll dig into those.
Application — OTel + Loki + Tempo, the Standard Stack
The foundation is unremarkable. Every cortex application is instrumented with OpenTelemetry, with traces going to Tempo, logs to Loki, and metrics to Mimir — the standard Grafana Cloud setup.
There's no special trick here. What matters is the discipline: every app emits logs and traces in the same shape. That uniformity is what lets AI later run something like {app="<service>"} |~ "error" through MCP and investigate across services.
I covered the actual instrumentation in AI Harness Series Part 4 (Self-Healing), so I'll leave the details there. The point worth repeating is: a standard OTel stack, properly laid down, is the precondition for everything AI-driven that comes later.
Infrastructure — Cloud Run / BigQuery / Pub/Sub Metrics, All Into Mimir
cortex runs on GCP and stitches together Cloud Run, Cloud Run Jobs, BigQuery, Pub/Sub, Cloud Tasks, and the usual suspects. Each GCP resource's metrics (CPU, memory, execution count, latency, queue dwell time, etc.) flow through Cloud Monitoring into Mimir.
Nothing special here either — just standard GCP metrics, all gathered into one Mimir instance. But that "one place" property pays off later: AI can answer "which service used the most CPU last week?" or "is there a worker with a clogged queue?" naturally, because everything is queryable from a single store. MCP picks it up from there.
That's it for the foundation. Standard observability stacks are well-documented elsewhere; go read Grafana's and OpenTelemetry's docs if you want the details.
The interesting AI-era design judgments are in the next two axes — CI and LLM.
CI — Ship Logs to Loki via Post-Hoc Pull, Not Webhook Push
cortex runs CI on GitHub Actions, and I ship every CI log into Grafana Loki.
"Why? GitHub Actions has a perfectly good UI for that" is a reasonable question. The reasons are concrete:
- GitHub's Actions API is awkward for AI to query
- One Loki instance holds CI logs and application logs together, so you can cross-query them
- LogQL alerts turn CI failure into a structured signal
- AI can ask "any tests that have been broken since last week?" in natural language
But the shipping mechanism is unusual. The choice cortex made:
Don't push logs from inside the CI run. After the run finishes, pull them from the GitHub API.
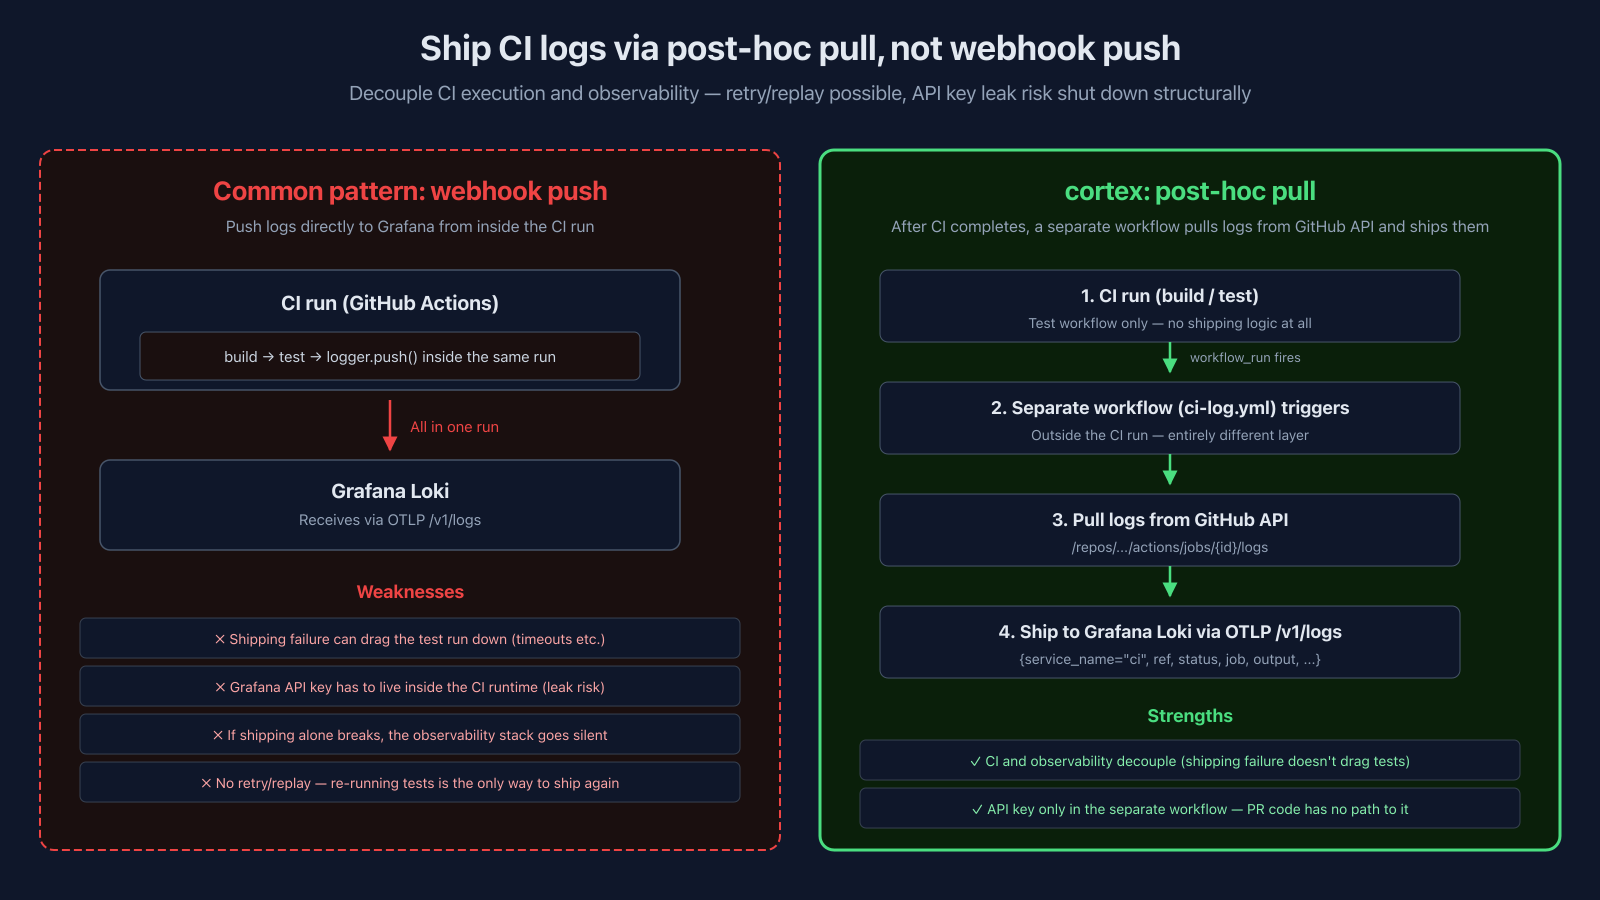
Concretely:
- When the Test job ends, a
workflow_runevent fires - A separate workflow dedicated to log shipping triggers
- That workflow pulls logs from the GitHub API (
/repos/.../actions/jobs/.../logs) - Ships them to Grafana Cloud as structured JSON (job / status / ref / pr / commit / output, etc.) via OTLP
/v1/logs
Filter on {service_name="ci", ref="main", status="failure"} and you get just the main-branch CI failures, cleanly.
Why pull instead of push:
- CI execution and observability decouple. If shipping fails, the test run is unaffected. You can also retry / replay shipping independently
- No path for PR code to touch the API key. The shipping workflow runs in the default-branch context and uses base-repo secrets, not whatever a fork PR brought. The test workflow itself never touches the Grafana API key — that's a structural guarantee, not a "we trust it won't leak"
- Shipping failure becomes observable. If shipping lives inside CI, a shipping bug means the observability stack goes silent — and you don't notice. Split them, and the shipping workflow's success / failure is itself something you can alert on
The moment a main-branch failure shows up, a LogQL alert fires and Slack gets pinged. That's the trigger for Self-Healing, which I cover in Part 2.
LLM — Gemini and Claude Code, Two Different Shapes
The last axis is LLM observability. cortex uses both Gemini API and Claude Code (Anthropic's official CLI) heavily, and both cost money. The reason I shape them differently isn't really about "what kind of question" — it's about where you can instrument:
- Gemini — I own the calling code, so I can wrap every call with a common helper and emit metrics inline. Prometheus is the natural fit.
- Claude Code — It's an external CLI; I can't wrap its calls from the inside. Usage shows up as records after the fact. A structured store (BigQuery) is the natural fit.
The "real-time vs SQL aggregation" framing of the question is a consequence of where you can instrument, not the cause. With that clarified, here's how each one plays out.
Gemini — Prometheus, Cost Visible in Real Time via Client-Side Estimation
cortex uses Gemini everywhere: db-graph table description generation, code-graph field type inference, general context generation. What I want to see is what's expensive right now, with no lag. If a runaway prompt or batch job kicks off, I don't want to wait until tomorrow's billing report.
So every Gemini call goes through a common wrapper (traceGeminiCall) that emits four metrics per call:
gemini.tokens.total— cumulative tokens (labels:model/service/type=prompt|completion)gemini.requests.total— request count (labels:model/service/status)gemini.request.duration— latency histogramgemini.cost.usd— estimated cost (labels:model/service)
The design choice that splits opinions is: who computes the cost? Two options:
- A. Pull from Google Cloud Billing API after the fact — accurate, but billing lags by hours to a day, and there's no per-task cost granularity
- B. Compute client-side from token counts × a price table — instant, with per-task granularity attached by you, but the price table needs upkeep
I picked B. The price table lives in a constant called GEMINI_PRICING and gets manually bumped whenever Google moves prices. Just gemini-3-flash / gemini-3-pro with input/output unit prices each. Nothing fancy.
The real reason for B is per-task granularity, not just speed:
- You can't tune what you can't attribute. Cloud Billing tells you "Vertex AI was $X total this month." But what you actually want to trim is "the db-graph table description generation cost $X," "the code-graph field type inference cost $Y," "that one prompt cost $Z" — sub-units. With client-side wrapping you attach
service/model/ call-site context as labels, and you can later slice by any of them in PromQL. - Real-time visibility is a bonus — runaway prompts and batches don't wait for tomorrow's billing.
- Price table maintenance is light (Google doesn't change prices often), so the upkeep cost is trivial.
- Cloud Billing API authentication, fetching, normalization, fan-out is its own pipeline of weight you'd have to maintain.
Then I emit gemini_cost_usd_USD_total as a cumulative Prometheus counter (the doubled usd_USD comes from OTel meter name gemini.cost.usd combined with the unit USD during Prometheus exporter conversion) and PromQL can answer "how much did we spend in the last hour" directly: sum(increase(gemini_cost_usd_USD_total[1h])). Alert fires at $1/hour, info severity, into Slack. Simple as that.
Prometheus is what you want when the question is "right now."
Claude Code — Send to BigQuery, Built for SQL Aggregation
Every developer at the company uses Claude Code. It costs money too. I want to know who used how much, in which repo, with how many tokens.
The question that split opinion: "Should Claude Code usage go to Loki too?"
The answer: No, into BigQuery.
Why? Because Claude Code usage is, fundamentally, a structured ledger:
email— the userrepository— which repo it was used intimestamp— wheninput_tokens/output_tokenscache_creation_input_tokens/cache_read_input_tokens— prompt-cache effectiveness included
And the questions you want to ask look like:
- "Last week, what's the cumulative spend for Team A members?"
- "How much did edits on Repo X cost over the past month?"
- "What's the prompt-cache hit ratio difference between teams?"
All of these are SQL aggregation questions. LogQL aggregation and joins on Loki are painful. BigQuery, with a DAY partition and email as the primary key, just writes naturally.
So the Claude Code → BigQuery pipeline runs in four stages:
- Emit — A bundled analyzer in Claude Code POSTs
UsageInput(token info only, no email) to an internal endpoint - Auth proxy — A Cloudflare Edge Router worker validates
CORTEX_API_KEYand stamps the user's email onto the request asX-Cortex-User-Email - Ingest — A Cloud Run API dedupes and publishes to Pub/Sub
- Persist — A Cloud Run worker pulls from Pub/Sub, validates the schema, and streaming-inserts to BigQuery
Two structural points worth calling out:
- Identity authority lives at the Edge Router. User identity is resolved exactly once, there. The emit side (Claude Code) never holds the email. This shuts down whole classes of client-side id-spoofing and social-engineering paths structurally
- Pub/Sub gives async decoupling. Ingest and worker are separate, so backpressure on the worker doesn't affect ingest response times. On failure, Pub/Sub DLQ retries up to five times
What sits in BigQuery is visible day-by-day through the internal portal I'll cover in Part 2. Here's what it actually looks like:
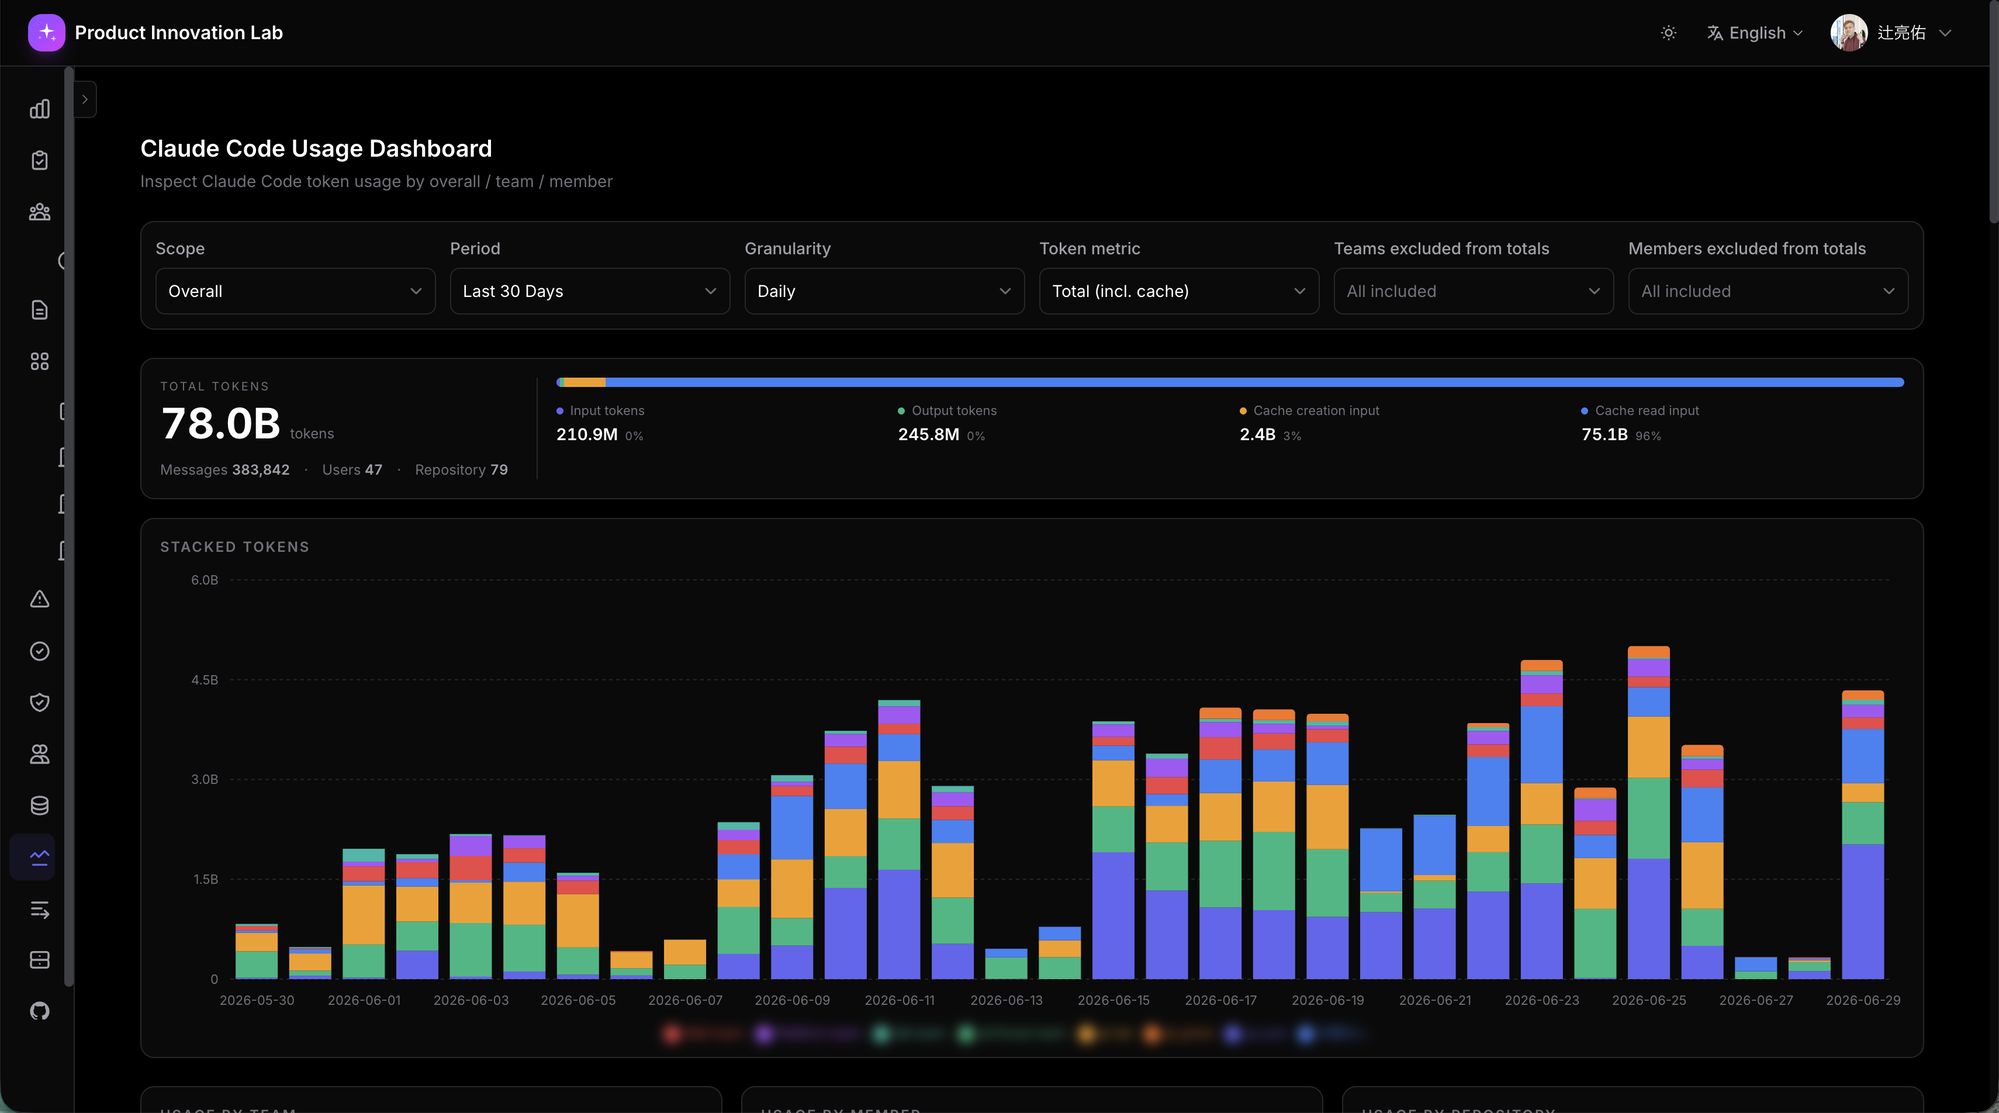
The numbers are interesting enough to mention briefly: in the last 30 days, 78.0B tokens / 384K messages / 47 users / 79 repositories. The one to focus on is Cache Read Input at 75.1B (96% of total) — prompt-cache is dramatically effective. Cache read tokens cost roughly 1/10 of standard input pricing, so against the cache-less counterfactual, the input effective cost works out to roughly 7× cheaper at the blended level. "Aggregation-shaped backend matched to the question" is the design choice; what it buys you is that this kind of operationally important metric falls out of SQL naturally and shows up daily. Doing the same thing in LogQL would be a battle.
As a side note: MCP tool-call logs end up in BigQuery too (cortex.mcp_tool_calls), but via a simpler path — each MCP server just writes records directly, no OTel in the loop. The "annotation graph MCP used ~50,000 times by ~73 people" figure from the previous series came from this exact table.
The core point of this layer is: don't dogmatically force everything through OTel — match the tool to the qualitative nature of the aggregation.
To Be Continued
That's the four axes (Prometheus / BigQuery / Loki) and the design judgments behind each. The write-side of the observability stack is wrapped up.
But shaping the write side isn't the whole story. The moment production data flows through the stack, PII becomes a constraint you have to design around. And the data has to actually be consumable by AI through MCP, with a thoughtful integration surface for both humans (web dashboards) and AI (MCP). Connect all of that, and the real driver of Self-Healing comes into focus from the observability side. That's the Part 2 story.
Thanks for reading. Part 2, "Observability Design for the AI Era — Reconciling PII Protection With AI Searchability, and Driving Self-Healing," follows in a week.
Footnotes
-
"cortex" here refers to airCloset's internal AI platform codename. Unrelated to Snowflake Cortex, Palo Alto Networks Cortex, etc. ↩
comments (0)
no comments yet.