
みなさまこんにちは!エアークローゼットでCTOをしている辻です。
直前の連載code-graph deep dive後編で、「46リポジトリに跨るコードベースをAIにセマンティック検索できる形にした」という話を書きました。その最後に残した課題のひとつが「動的解析の不在」でした:
graphに乗っているのは「edgeが静的に存在する」という事実だけで、「実際にそのedgeが本番でどれくらい使われているか」は分かりません。
graphが「静的事実」を渡してくれても、本番でいま何が起きているかは別軸でAIに渡してあげる必要があります。つまり、静的解析と同じ発想を、そのまま観測スタックにも持ち込まないといけない。
今回はその話を、設計編(本記事)と実践編の2つに分けて書きます。本記事は4つの監視対象(アプリケーション / インフラ / CI / LLM)を、それぞれの問いの性質に合わせて違う形でObservableにする設計判断の話。
4つの観測対象を別々の形でObservableにする
code-graph連載で得た一番大きな教訓は、「AIに渡す前にデータを正しい形にしてあげる」必要がある、ということでした。46リポジトリ分のソースコードをそのまま投げてもcontext windowは足りないしハルシネーションも起きる。だから静的解析でグラフ化して、境界ノードに意味を載せて、SAME_ENTITYで繋いで、とObservableにしてから渡す。
観測スタックも全く同じ構造の問題を持っています。本番の生ログをそのままAIに渡しても、
- ログの量でcontextが埋まる
- どこがerrorでどこが正常なlogかAIには区別がつかない
- メトリクスとログとトレースが断絶している
- そもそも「いま何にいくらかかってるか」の答えは生ログには載っていない
= AIに渡せる形でObservableにする必要がある、という同じ問題。
ここで重要なのは「Observableにする形」はAIが何を答えるべきかで変わる、という点です。cortex(社内AIプラットフォーム)では、監視対象を4つに分けて、それぞれ別の問いに対応した形で乗せています:
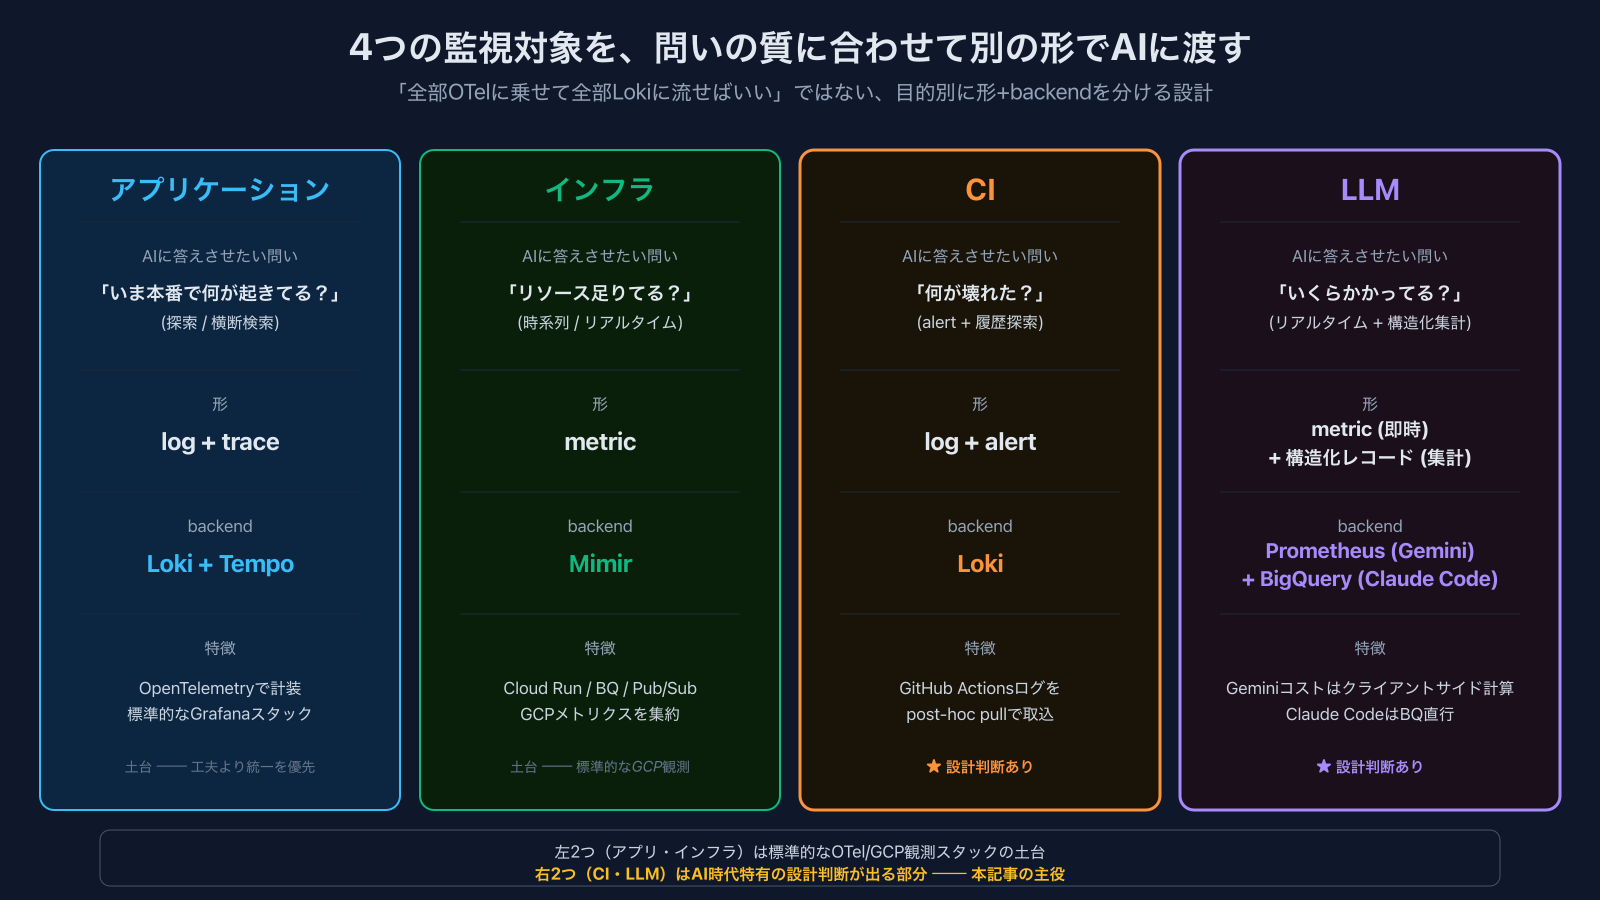
| 監視対象 | AIに答えさせたい問い | 形 |
|---|---|---|
| アプリケーション | 「いま本番で何が起きてる?」(探索) | log + trace |
| インフラ | 「リソースは足りてる?落ちてない?」(時系列) | metric |
| CI | 「何が壊れた?いつから壊れてる?」(alert + 履歴探索) | log + alert |
| LLM | 「いくらかかってる?誰がどれだけ使った?」(リアルタイム + 構造化集計) | metric + 構造化レコード |
「全部OTelに乗せて全部Lokiに流せばいいじゃん」という選択肢は確かにあります。でもそうすると、「リアルタイムの『今いくら』」と「『先月の累計をteam別に集計』」のような質的に違う問いを1つのbackendで答えようとして、どこかが苦しくなる。ここを目的別に分けたのがcortexの選択です。
以下、4つの軸を順に書きます。アプリケーションとインフラは「土台」として簡単に触れ、CIとLLMはAI時代特有の設計判断が出るので深掘りします。
アプリケーション ── OTel + Loki + Tempoの標準スタック
土台はシンプルです。cortexの各アプリケーションはOpenTelemetryで計装していて、traceはTempo、logはLoki、metricはMimirに流す ── というGrafana Cloudの標準形。
ここは特別な工夫はしておらず、重要なのは「全アプリが同じ形でログとトレースを出す」という統一だけです。これがあるから、後でMCP経由でAIが {service_name="<service>"} |~ "error" のようなLogQLを投げて横断的に調査できる。
具体的な計装方針は別記事AI Harness連載Part 4 (Self-Healing)で触れたので、本記事では深掘りしません。「標準的なOTelスタックがちゃんと敷かれているか」が、この後のAI駆動運用の前提になる、とだけ書いておきます。
インフラ ── Cloud Run / BigQuery / Pub/SubのmetricをMimirに集約
cortexはGCP上で動いていて、Cloud Run / Cloud Run Job / BigQuery / Pub/Sub / Cloud Tasks等を組み合わせて使っています。各GCPリソースのmetric (CPU / memory / 実行回数 / レイテンシ / queue滞留時間等)は、Cloud Monitoring経由でMimirにexportしています。
ここも特別な工夫はしてなくて、標準的なGCP metricをGrafana CloudのMimirに集約しているだけ。ただ「全インフラmetricが1ヶ所に集約されている」状態を作っておくと、AIが「先週、一番CPU使ってたserviceは?」「queueが詰まってるworkerある?」みたいな問いに自然に答えられるようになる ── これも後でMCP経由で効きます。
ここまでが「土台」です。一般的な観測スタックの話なので、詳しくはGrafanaやOpenTelemetryの公式ドキュメントを当たってください。
ここから先(CIとLLM)がAI時代特有の設計判断が出る部分です。
CI ── webhook pushではなくpost-hoc pullでLokiに流す
cortexはGitHub ActionsでCIを回していますが、CIのログをそのままGrafana Lokiに流しています。
「GitHub ActionsのログはGitHub UIで見られるじゃん」という疑問は当然あって、ただこれには明確な理由があります:
- 調査のたびにAIにGitHub APIを叩かせるのは遅く認証も煩わしい。一度Lokiに構造化して入れれば、AIがアドホックに横断検索できる状態になる
- 別レポジトリのCI結果も、アプリログも、全部1つのLokiに乗ってると横断クエリできる
- LogQL alertで失敗を構造化された判定にできる
- AIが「先週から壊れてるテストある?」みたいな問いを自然言語で投げられる
ただし送信の仕方が普通と違います。cortexの選択は:
CI実行中にログをpushするのではなく、完了後にGitHub APIからpullする
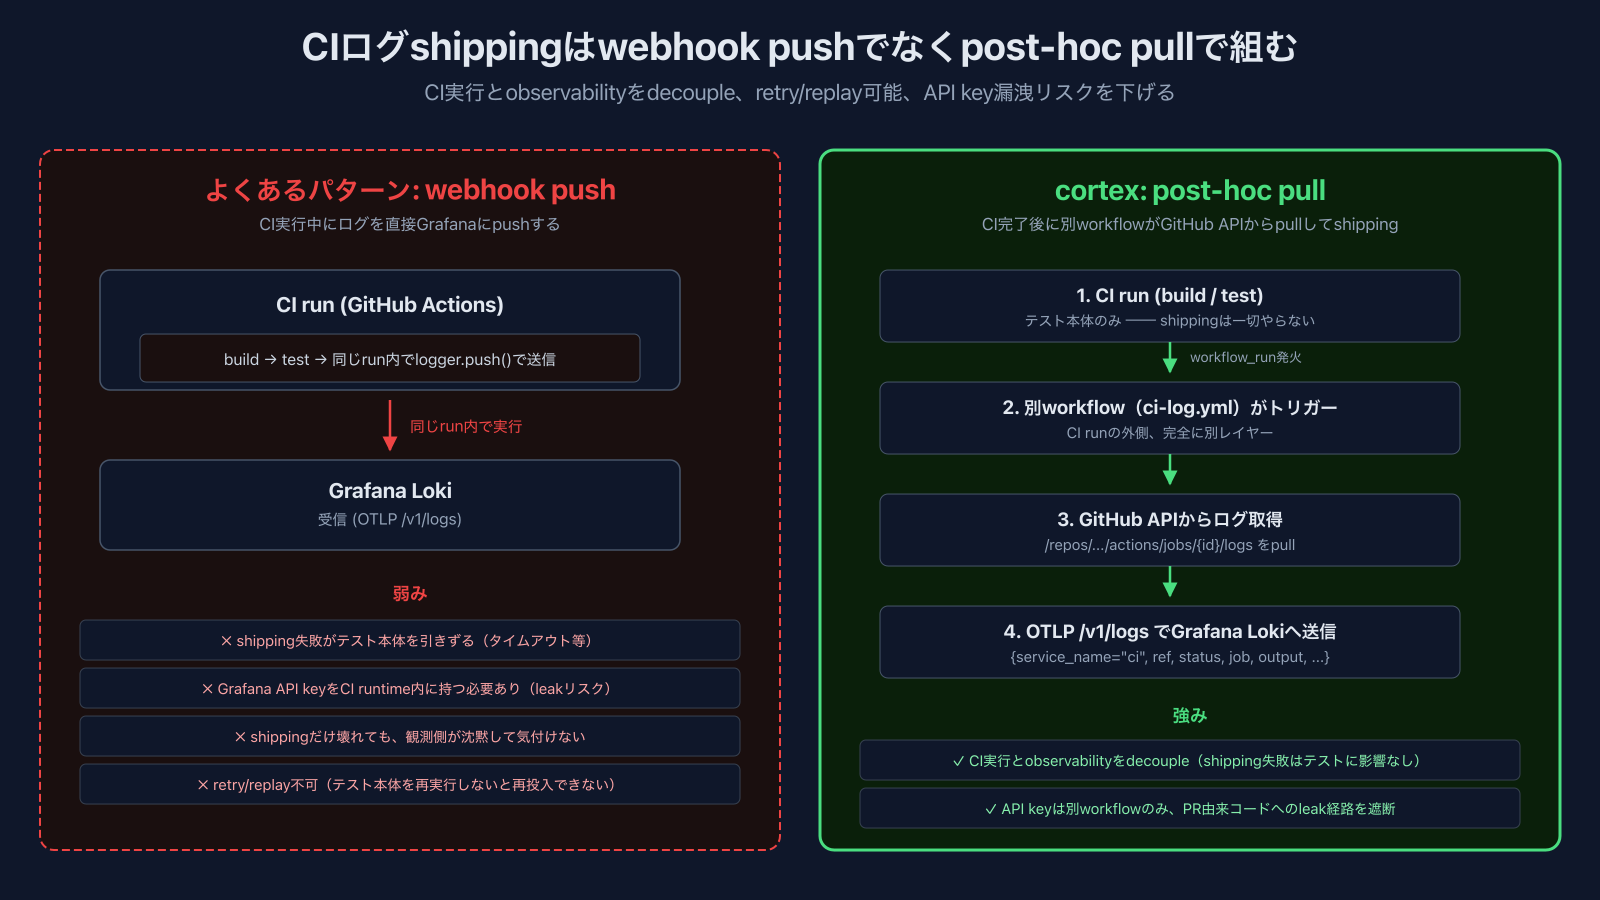
具体的には:
- Testジョブが終わると
workflow_runイベントが発火 - ログ送信用の別workflowが起動される
- そのworkflowがGitHub API (
/repos/.../actions/jobs/.../logs)からログを取得 - 構造化されたJSON (job / status / ref / pr / commit / output等)としてOTLP
/v1/logsでGrafana Cloudに送信
{service_name="ci", ref="main", status="failure"} でフィルタすると、mainブランチでのCI失敗だけが綺麗に拾える。
なぜpush方式じゃなくpull方式か:
- CI実行とobservabilityを切り離せる。逆に送信だけリトライ / 再実行も可能
- PR由来コードがkeyに触れる経路自体が存在しない:
workflow_runでトリガーされる別workflowはデフォルトブランチのcontextで実行され、fork PR側のコードではなくbase repoのsecretを使う。つまりテスト本体はGrafana API keyにそもそも触れない構造的保証 - 送信失敗の検知が独立できる、送信が壊れた時に観測スタックが沈黙して気付けない。分離していれば、ログ送信workflowの成否それ自体が観測対象になるので、そこにalertを貼れる
そしてmainブランチでfailureが出た瞬間にLogQL alertが発火し、Slackに通知される ── これが実践編で扱うSelf-Healingの起点になります。
LLM ── GeminiとClaude Code、2つの違う形
最後の軸がLLMの利用観測です。cortexはGemini APIとClaude Code (Anthropicの公式CLI)を両方ヘビーに使っていて、どちらもお金がかかる以上、利用状況を把握したい(ただし課金形態は違っていて、Geminiは従量課金、Claude Codeはsubscription。この違いは後で効いてきます)。両者でbackendを分けている根本的な理由は計装地点(instrumentation locus)の違いにあります:
- Geminiは呼び出し元のコードを自分で握っているので、共通wrapperでinline emitできる → metric (Prometheus)が自然
- Claude Codeは外部CLIでwrapperでラップできない。利用ログは事後レコードとして降ってくる → 構造化保存先(BigQuery)が自然
「リアルタイムで見たいか / SQL集計したいか」という問いの性質は、この計装地点の違いから派生的に決まります。以下、順に深掘りします。
Gemini ── Prometheusで「いま、何が高い」を即時可視化
cortexはGeminiをdb-graphのテーブル説明文生成、code-graphのフィールド型推論、各種コンテキスト生成 ── 至るところで叩いています。ここで答えたいのは「いま、何が高い」を遅延なしに見ること。暴走promptや暴走batchが走った時に、翌朝のbillingまで待ちたくない。
そこで、全Gemini呼び出しを共通のwrapper (traceGeminiCall)で包んで、呼び出しごとに4本のメトリクスを出力する設計にしています:
gemini.tokens.total── 累積トークン(labels:model/service/type=prompt|completion)gemini.requests.total── リクエスト数(labels:model/service/status)gemini.request.duration── レイテンシヒストグラムgemini.cost.usd── 推定コスト(labels:model/service)
ここで設計判断が分かれるのが、「コストを誰が計算するか」です。選択肢は2つ:
- A. Google Cloud Billing APIから後追いで取得する ── 正確、でもbilling反映まで数時間〜1日のラグ + タスク単位のコスト粒度がない
- B. 呼び出し直後にトークン数 × 単価表でクライアントサイド計算する ── 即時 + タスク単位の粒度を自前で付けられる、でも単価表のメンテが要る
採用したのはBです。単価表は GEMINI_PRICING という定数で持っていて、Googleが値段を変えたら手動で更新する。gemini-3-flash や gemini-3-pro ごとにinput / output単価を持っているだけの素朴な表。
なぜAを捨ててBを採ったか。本命の理由はリアルタイム性です:
- billingは数時間〜1日遅れる。暴走promptや暴走batchが走ったら、翌朝のbillingで気付くまで一晩コストを垂れ流すことになる。クライアントサイドで呼び出し直後にトークン数×単価で計算すれば、
service単位(code-graph/gcs-transformer/db-dictionaryなど、アプリ / パイプライン単位の粒度)で「いま何が高いか」が数分で見える ── billingがリアルタイムには決して答えられない速度です - 単価表のメンテ頻度が低い(Googleも値段はそうそう変えない) ── 負債としては小さい
- Cloud Billing APIの認証・取得・正規化・再分配のパイプライン自体がそれなりに重い
そしてPrometheusの累積カウンタとして gemini_cost_usd_USD_total に出すと(OTel側のmetric名 gemini.cost.usd + unit USD がPrometheus exporterで合成された形)、GrafanaのPromQLでそのまま sum(increase(gemini_cost_usd_USD_total[1h])) のような形で「直近1時間でいくら使った?」が答えられる。これを「$1/hour超えたらinfoアラート」でSlackに飛ばすシンプル設計。実運用でも、後からPromQLで集計するというより、この閾値超えのSlack通知で暴走に即気付くのが主用途になっています。
ここで一つ線を引いておくと、このgemini.cost.usdカウンタが持つラベルはmodelとserviceの2つだけで、serviceは粗い(アプリ / パイプライン単位のbounded集合)です。「あのprompt一つにいくら」という呼び出しコンテキスト単位の粒度をラベルに載せようとすると、多数のリポジトリ×各種推論でラベルの組み合わせが爆発し、時系列DB (TSDB)が耐えられません。だからPrometheus側はtripwire(暴走検知)に徹して、service単位の粗い粒度で即時アラートを出す役割に割り切っています。プロンプト単位の細かいコスト帰属が欲しいなら、それは時系列ではなくSQLの問いです ── tokenレコードをBigQueryに落として後から好きな軸で集計する形になり、これは次に述べるClaude CodeをBQに流すのと同じ理由です。「計装できる」と「時系列であるべき」は別の問いで、細粒度の集計はGeminiもClaude Codeも同じBQに寄っていく。
リアルタイムの「いま」を答えるのは、Prometheusがいちばん向いてる形です。
Claude Code ── BQに溜めて構造化集計に強くする
社内の開発者は全員Claude Codeを使っています。ただしこちらはGeminiと事情が違って、subscriptionなのでトークン使用量がそのまま金額になるわけではありません。ここで見たいのはコストそのものより利用状態です。誰がどれだけ使っているか、どのリポジトリでどれだけトークンを消費しているか、cacheがどれだけ効いているかを把握して、使い方の改善につなげたい。
ここで設計が分かれた質問:「Claude Codeの利用ログもLokiに流すべきか?」
答え: NO、BQに溜める。
なぜか。Claude Code利用ログは本質的に構造化された帳簿だからです:
email── 利用者repository── どのリポジトリでの利用かtimestamp── いつinput_tokens/output_tokenscache_creation_input_tokens/cache_read_input_tokens── prompt-cacheの効きを含む
これを引きたい問いはこんな形:
- 「先週、チームAのメンバーが累計でいくら使った?」
- 「リポジトリXの編集に1ヶ月でいくらかかってる?」
- 「prompt-cacheのhit ratioはチーム間でどれくらい差がある?」
全部SQL集計向きの問いです。LokiのLogQLではaggregationもjoinも辛い。一方BigQueryならDAYパーティション + emailを主キーに普通に書ける。
そこでClaude Code → BQパイプラインを4段階で組んでいます:
- Emit ── Claude Code側に組み込んだanalyzerが
UsageInput(email無しのtoken情報のみ)を社内エンドポイントにPOST - Auth proxy ── Cloudflare Edge Router workerが
CORTEX_API_KEYを検証して、そこで初めて利用者emailをX-Cortex-User-Emailとして付与 - Ingest ── Cloud Run受信APIがdedupしてPub/Subにpublish
- Persist ── Cloud Run workerがPub/Subからpull、schema検証、BQにstreaming insert
設計的に効いているポイントを2つ:
- identity authorityをEdge Routerに集約 Routerでしかやらない。emit側(Claude Code)はemailを持たない。これでクライアント側のid詐称や、social engineering系の経路を構造的に閉じる
- Pub/Subでasync分離: ingestとworkerを分けて、worker側で詰まってもingestの応答時間に影響しない。失敗時はPub/Sub DLQで最大5回retry
そしてBQに溜まったものは、実践編で扱う社内ポータルから「誰がどれだけ」を毎日見られる状態にしています。実物がこれです:
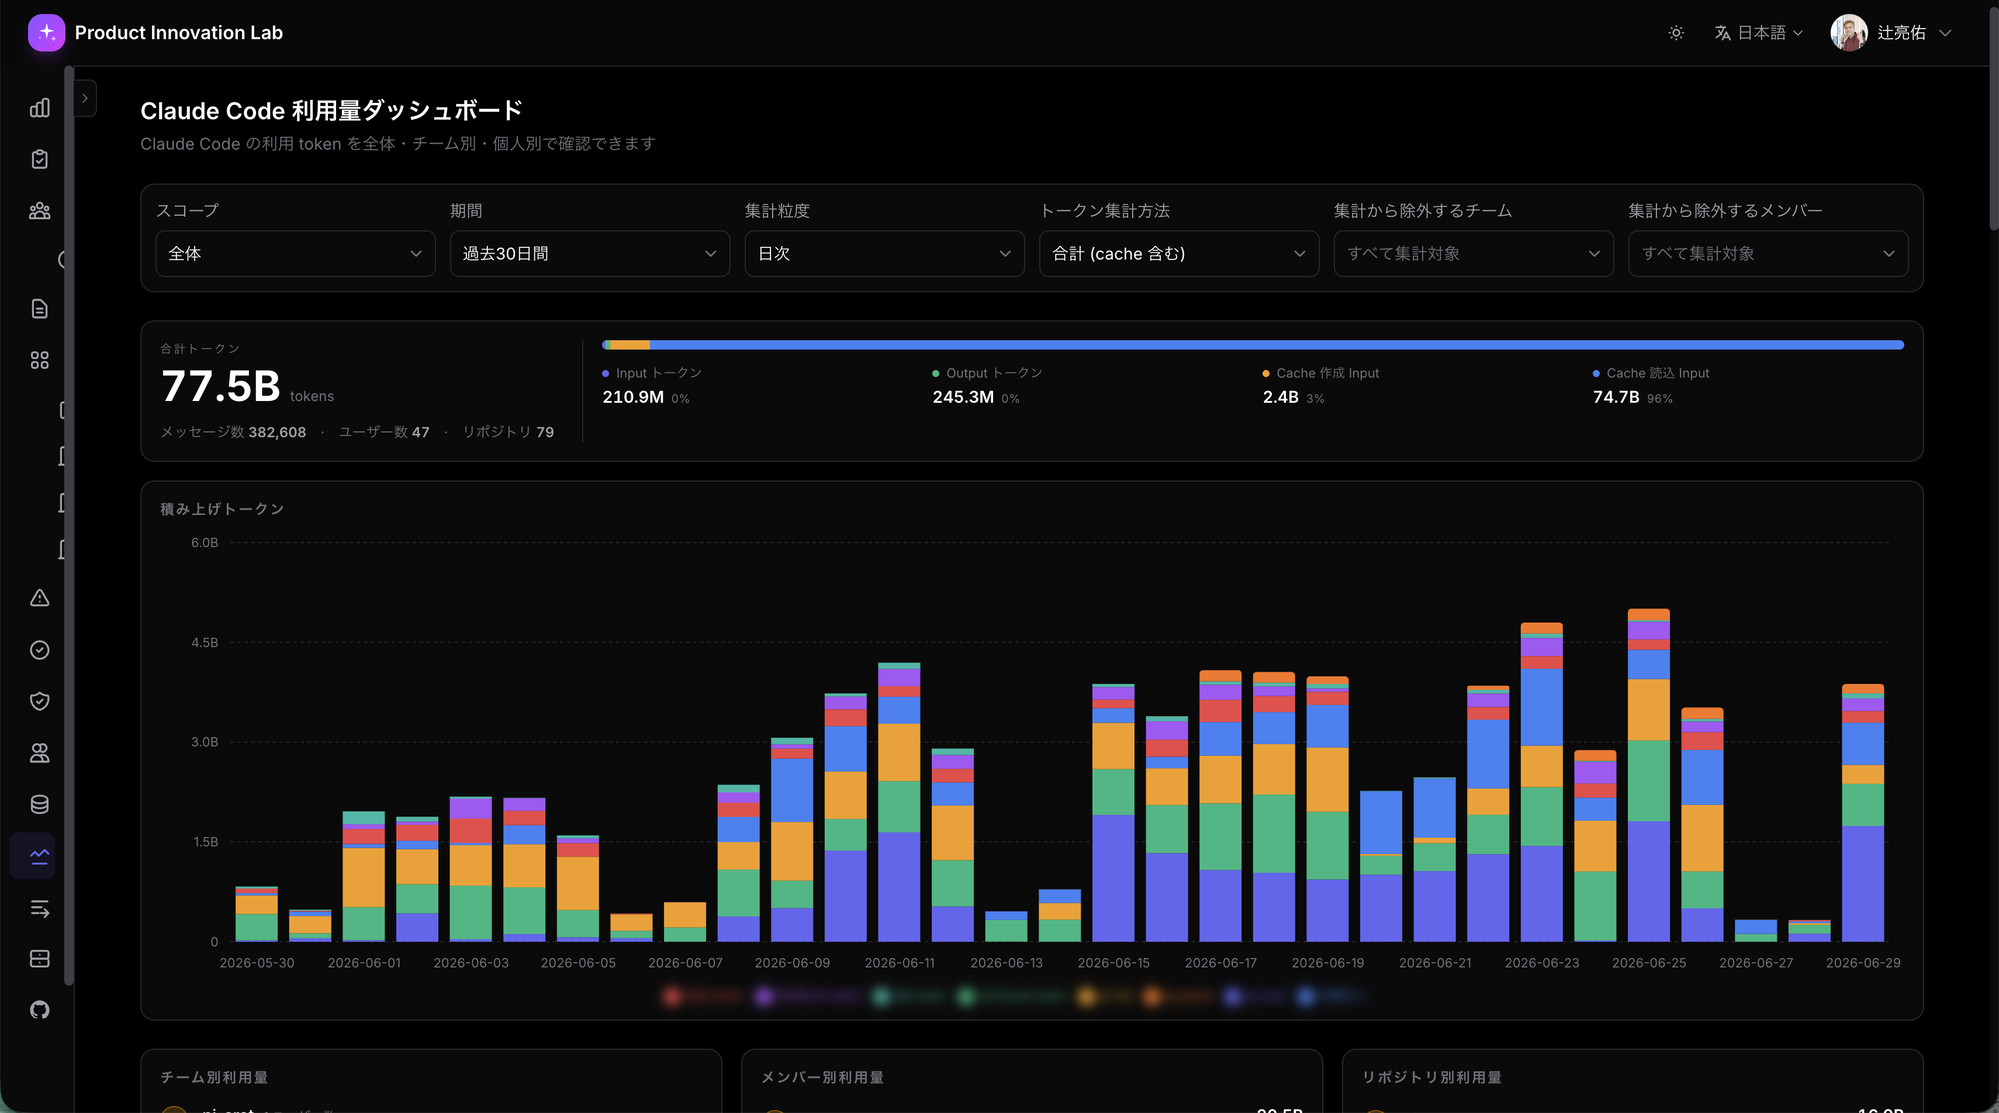
数字が興味深いので軽く触れておくと、過去30日で77.5Bトークン / 382Kメッセージ / 47ユーザー / 79リポジトリ。そして注目すべきはCache読込Inputが74.7B(全体の96%)という点です。これはprompt-cacheが劇的に効いていることを示しています。subscriptionなのでこれがそのまま金額に跳ねるわけではありませんが、cache読込の実効input単価は標準input単価の約1/10なので、仮にAPI従量課金で同じ使い方をしたら、cacheなし前提と比べてinput実効単価ベースで7倍前後効率が良い計算になります。利用効率をこうやって具体的な数字で把握できるのが可視化の狙いで、「集計の質的な性質に合わせたbackend」という設計判断のおかげで、こういう指標が自然にSQLで引けて毎日見える状態になっています。LogQLで同じことをやろうとしたら大変です。
ちなみにMCPの利用ログも似た形でBQに溜めています(cortex.mcp_tool_calls)。こちらはOTelですらなく、各MCPサーバーが直接BQにレコードを書き込む構造。前回の連載で「annotation graphのMCPが約50,000回 / 約73人に使われている」と数字を出したのは、全部このテーブルから取っています。
「全部OTel」教義に寄せきらず、集計の質的な性質に応じて道具を分けているのがこの層の核心です。
つづく
ここまでで4つの監視対象(アプリケーション / インフラ / CI / LLM)と、それぞれの設計判断を書きました。観測スタックの書き込み側の話としては一旦完結します。
ただ、「Observableにしただけ」では話は終わらない。観測スタックには本番データが流れる以上、PIIとAIの検索性をどう両立させるかという問題が必ず出ます。そして全部繋がると、自動修復(Self-Healing)の本当の駆動源が観測スタック側から見えてくる ── というのが実践編の話です。
長文をお読みいただきありがとうございました。実践編「AI時代のObservability設計 - PIIとAIの検索性を両立させ、自動修復する」も公開済みです。続けてどうぞ。
comments (12)
The sink-vs-pump framing in the comments is strong. I’d separate “is it hot right now?” telemetry from “what evidence changed the decision?” records. Prometheus-style counters are great for current pressure, but decision/evidence records need to survive as structured facts: which call site, which source, which retry path, what was repaired, what was trusted, and what changed the downstream result. That split matters even more once AI is consuming the telemetry. The trace is useful, but the facts that explain the decision need to outlive the prompt transcript.
You're pointing at exactly the split the whole harness is built around, though I'd push the durable half one step further than the record itself. The fix landing as a PR is the first layer of that: a PR is a durable evidence record, which source, which repair, what a separate pass verified, all of it outlives the transcript by design. The transcript is what the model saw, the PR is what actually grounded the decision, and those two diverge the moment anything gets retried. We also index those PRs into a separate release graph, so the evidence isn't just archived, it's queryable over MCP later: which change touched what, why it merged, what it was linked to. The record stays a live fact instead of a dead log. But the record alone still only tells you what happened once. The second layer is that every self-healing fix is required to add a lint or type gate as part of the same PR, so the fix doesn't just leave a trace, it leaves a constraint. The same class of failure can't recur, because the evidence got compiled into a rule the next run has to satisfy. I wrote about that recurrence loop in more depth [here](https://dev.to/ryantsuji/fixed-before-anyone-notices-stronger-after-every-fix-self-healing-recurrence-prevention-series-1e86) if you're curious. That's the part I care about most: the decision doesn't just survive as a fact you can reconstruct later, it survives as something the system now enforces.
The part about per-call-site cost attribution is where I want to push back, because I don't think the design as written can actually produce what it claims. You write about wanting to slice by call-site context: "the db-graph table description generation cost $X," "that one prompt cost $Z." But gemini.cost.usd is a Prometheus counter carrying model, service, and type labels. The instant service holds the call-site identity you actually want to slice by, the cardinality goes sideways. A 46-repo codebase pushing field type inferences and table descriptions, each a distinct label value, produces series counts Prometheus is not built to absorb. And if service stays coarse to stay safe, then "the db-graph table description cost $X" stops being answerable from the counter, and you're left with what Cloud Billing already hands you. I learned this the expensive way. Same shape of problem, different vendor. The meter looked healthy, dashboards rendered confident numbers, and somewhere around week three the scrape started timing out because the label space had quietly grown past what the TSDB could chew. The cost chart kept moving on the wall while the storage underneath was choking. So the three escape hatches I've seen work: keep the counter coarse and ship per-call-site detail to BigQuery as structured records (which is the same backend you chose for Claude Code, for the same reason), or attach exemplars with trace IDs so the time series stays clean and a human can drill down on a spike, or just admit that "which prompt cost the most this week" is a SQL question wearing a PromQL costume. The post frames Gemini and Claude Code as wanting different backends. My read is they want the same backend, for a reason the article doesn't quite state. Gemini goes to Prometheus because you can wrap the call. But "I can instrument this call" and "this should live as a time series" are two separate claims, and the cardinality ceiling is exactly where the second one breaks from the first. One thing I'd genuinely like to know: is service in your labels coarse, like a fixed handful of services, or is it carrying a call-site dimension I'm not seeing in the post? Because if it's coarse, the real-time dollar number is real and useful, but the "tune what you can attribute" payoff is softer than the framing makes it sound. And if it's not coarse, I'd love to see how you're keeping the cardinality from eating the TSDB, because that's the part I never solved cleanly.
You're right, and you've caught the article overstating what the counter can do. Let me give you the concrete answer. service is coarse. It's a bounded set of app/pipeline names, meet-pipeline, gcs-transformer, db-dictionary, code-graph, and so on, defaulting to the Cloud Run service name. The gemini.cost.usd counter carries exactly two labels, model and service. There's no call-site dimension on it, precisely because I'd hit the ceiling you're describing if I tried. So your read is correct on both counts. The real-time dollar number is real and useful, but the "which single prompt cost $Z" line in the post promises finer attribution than the counter delivers. That's a framing error on my part, not a thing the counter does. Where I'd push back slightly is on what the Prometheus side is actually for in practice. It isn't the aggregation surface at all. It's a tripwire. The counter exists so sum(increase(...[1h])) crossing a threshold pages Slack, so a runaway prompt or batch gets caught in minutes instead of the next morning's billing. Coarse service is enough for "something in gcs-transformer is on fire right now." That's the job it's doing, and it does it well. The per-call-site question, "which prompt burned the most this week," is exactly the SQL-shaped question you describe, and you're right that it wants the same backend as Claude Code. The token records can land in BigQuery with as much call-site context as I want to attach, no cardinality ceiling, and that's where that question should be answered. The article draws the Gemini/Claude split at "can I wrap the call," but your point is sharper: "can I wrap it" and "should it live as a time series" are different questions, and the second one is where the two converge back onto BigQuery. That distinction is better than the one I published, so I've gone and fixed that section of the post to say what the counter actually does. Thanks for the push.
Lo que más me gusta de este hilo es que todos los ejemplos convergen en la misma idea: las comprobaciones más fiables se hacen en el extremo del sistema, no en el origen. La conciliación del coste, el recuento esperado de ejecuciones de CI, la frescura de una tabla ETL... todos son casos de la misma regla: verificar la evidencia, no asumir que el proceso funcionó. Creo que ese patrón va incluso más allá de la observabilidad. Es una regla de diseño para sistemas con IA: cada capa debería producir evidencia verificable para la siguiente, y ninguna debería confiar únicamente en que la anterior "dice" haber tenido éxito. Al final, la confianza no emerge porque un componente sea fiable, sino porque cada afirmación deja un rastro independiente que otro componente puede comprobar.
That last line is the whole thing: trust doesn't come from a component being reliable, it comes from every claim leaving an independent trace something else can check. That generalizes further than I framed it in the post. It's basically the same reason the AI review layer works in what's coming in Part 2. The model's output isn't trusted because the model is good, it's trusted because it lands as a diff that a separate pass, and a human if needed, can verify against the graph. Same rule, one layer up. Every claim leaves a trace.
The "watch the sink, not the pump" framing from the comments thread is the sharpest distillation of the whole piece. The CI post-hoc pull design is the one I'd steal immediately. The structural guarantee that PR code never touches the Grafana API key isn't just a security win — it's an architectural clarity win. When the shipping workflow itself becomes observable, you've turned a silent failure mode into a monitorable service. That's the kind of design that pays forward for years. The BigQuery vs Loki decision for Claude Code usage is also the right call for a reason slightly different from what's stated. Claude Code on a subscription means the real question isn't cost per token — it's understanding usage patterns well enough to justify the subscription tier or negotiate it. SQL aggregation is exactly the right shape for that question. One thing I'd add to the LLM layer: tracking cache hit ratio per repository rather than just aggregate. The 96% you're seeing overall is impressive, but if two repositories are pulling the aggregate up while three others are cold-missing consistently, the fix (CLAUDE.md tuning, prompt restructuring) is very different per repo. Curious whether you're already slicing it that way.
Yeah, we slice per repo. Interesting thing is the spread is tighter than your hypothesis assumes. Nothing's cold-missing here, pretty much everything clears 90%, and cortex itself sits at 97.7%, which for a repo this size I think is genuinely high. So the per-repo cut mostly confirms the fleet is healthy rather than surfacing outliers to fix. Where it would earn its keep is exactly the scenario you describe, a couple of repos dragging while others quietly starve, and I'd want that visible the moment it happens rather than discovering it in the aggregate. Your subscription reframe is spot on though. The question isn't cost per token, it's whether usage justifies the tier, and SQL aggregation is the right shape for that.
The pricing-table choice is the one place I'd add a tripwire. Computing cost client-side from a GEMINI_PRICING constant buys you real-time visibility and per-call-site granularity, but it also creates a second copy of a fact the provider owns, and duplicated facts drift: the day the price sheet changes, every dashboard keeps rendering confident, specific, wrong dollar numbers, and nothing errors. The fix is cheap, a scheduled job that reconciles your computed spend against the billing API's actuals at day granularity and alerts when the delta exceeds rounding. You keep the inline numbers and the reconciliation catches the quiet divergence before finance does. Same logic as any denormalized cache: the copy is fine as long as something keeps checking it against the source of truth. The decoupled CI shipping has a similar quiet failure worth naming. If the post-hoc pull breaks, the outcome is not an error, it's an empty Loki, and an empty failure stream reads as good news, silence is the one signal every dashboard renders as health. Worth emitting an expected-volume check (N runs happened in GitHub, N landed in Loki, the diff should be zero) so missing data becomes a loud fact instead of a comfortable one. Really solid writeup, the match-the-backend-to-the-question framing is the right way to think about AI-consumable telemetry, and the identity-stamped-once-at-the-edge design is quietly the best part, one attestation point instead of every client asserting who it is. Looking forward to the PII and self-healing half.
Both of these are correct, and you've named the thing they have in common better than the article did. A client-side computed number is a denormalized copy of a fact the provider owns, and a denormalized copy is only safe if something keeps checking it against the source of truth. That's the frame, and I didn't have it in the post. On the pricing table: no, there's no reconciliation job today. The price constant just sits there, and you're exactly right that the failure is silent and confident, which is the worst kind. It's a gap I've been aware of and haven't closed, and "reconcile computed spend against billing actuals at day granularity, alert when the delta exceeds rounding" is the right shape for the fix. Cheap, and it turns a quiet divergence into a loud one before finance finds it. Good catch. The CI one is the same shape on the transport side, and it's the better catch because the failure is even quieter. An empty failure stream doesn't just render as health, it renders as the outcome you were hoping for. Part 2 (next week) spends its closing section on this exact family of problem, but framed at the code entrance: swallowed exceptions, errors logged at info level, the faucet being broken so nothing flows in. What your comment adds is the transport-side version I didn't cover, where the faucet is fine but the pipe between it and Loki broke. The expected-volume check (N runs in GitHub, N landed in Loki, diff should be zero) is the missing piece there. We do run that final-layer freshness idea for our ETL pipelines, monitoring the last table rather than trusting the source succeeded, but the CI shipping path specifically doesn't have it, and it should. The identity-stamped-once observation is the part I'm happiest someone noticed. One attestation point instead of every client asserting who it is was the whole reason for that shape. Thanks for reading this closely, and the PII/self-healing half lands next week.
The final-layer freshness you already run on ETL is the general form of both fixes, honestly: watch the sink, not the pump. Whether the pump is a price constant, a CI shipping workflow, or a source job, the only signal that cannot lie by omission is the destination containing what it should by now. And your reframe is the sharper half of this thread: an empty failure stream does not just read as health, it reads as the outcome you were hoping for, and hoped-for readings are exactly the ones that should cost evidence. If the comfortable interpretation requires a matching count, and the uncomfortable one is the default, the dashboard fails toward truth instead of toward comfort. Looking forward to part 2.
Nice way to put it, "watch the sink, not the pump." I knew the cost side was a weak spot but hadn't worked out how to close it, and tying it to the CI case makes the fix obvious.